Is today's housing supply a sweet spot for sellers?
Wondering if it still makes sense to sell your house right now? The short answer is, maybe.
An article from Calculated Risk shows there are 15.6% more homes for sale now compared to the same week last year. That tells us inventory has grown. But going back to 2019, the last normal year in the housing market, there are nearly 40% fewer homes available now:
How does this benefit sellers?
1. You Have More Options for Your Move
Are you thinking about selling because your current house is too big, too small, or because your needs have changed? If so, the year-over-year growth gives you more options for your home search. That means it may be less of a challenge to find what you’re looking for.
So, if you were holding off on selling because you were worried you weren’t going to find a home you like, this may be just the good news you needed. Partnering with a local real estate professional can help you make sure you’re up to date on the homes available in your area.
2. You Still Won’t Have Much Competition When You Sell
But to put that into perspective, even though there are more homes for sale now, there still aren’t as many as there’d be in a normal year. Remember, the data from Calculated Risk shows we’re down nearly 40% compared to 2019. And that large a deficit won’t be solved overnight. As a recent article from Realtor.com explains:
“. . . the number of homes for sale and new listing activity continues to improve compared to last year. However the inventory of homes for sale still has a long journey back to pre-pandemic levels.”
For you, that means if you work with an agent to price your house right, it should still get a lot of attention from eager buyers and could sell fast.
Bottom Line
If you're a homeowner looking to sell, now's a good time. You'll have more options when buying your next home, and there's still not a ton of competition from other sellers. If you’re ready to move, talk to a local real estate agent to get the ball rolling.
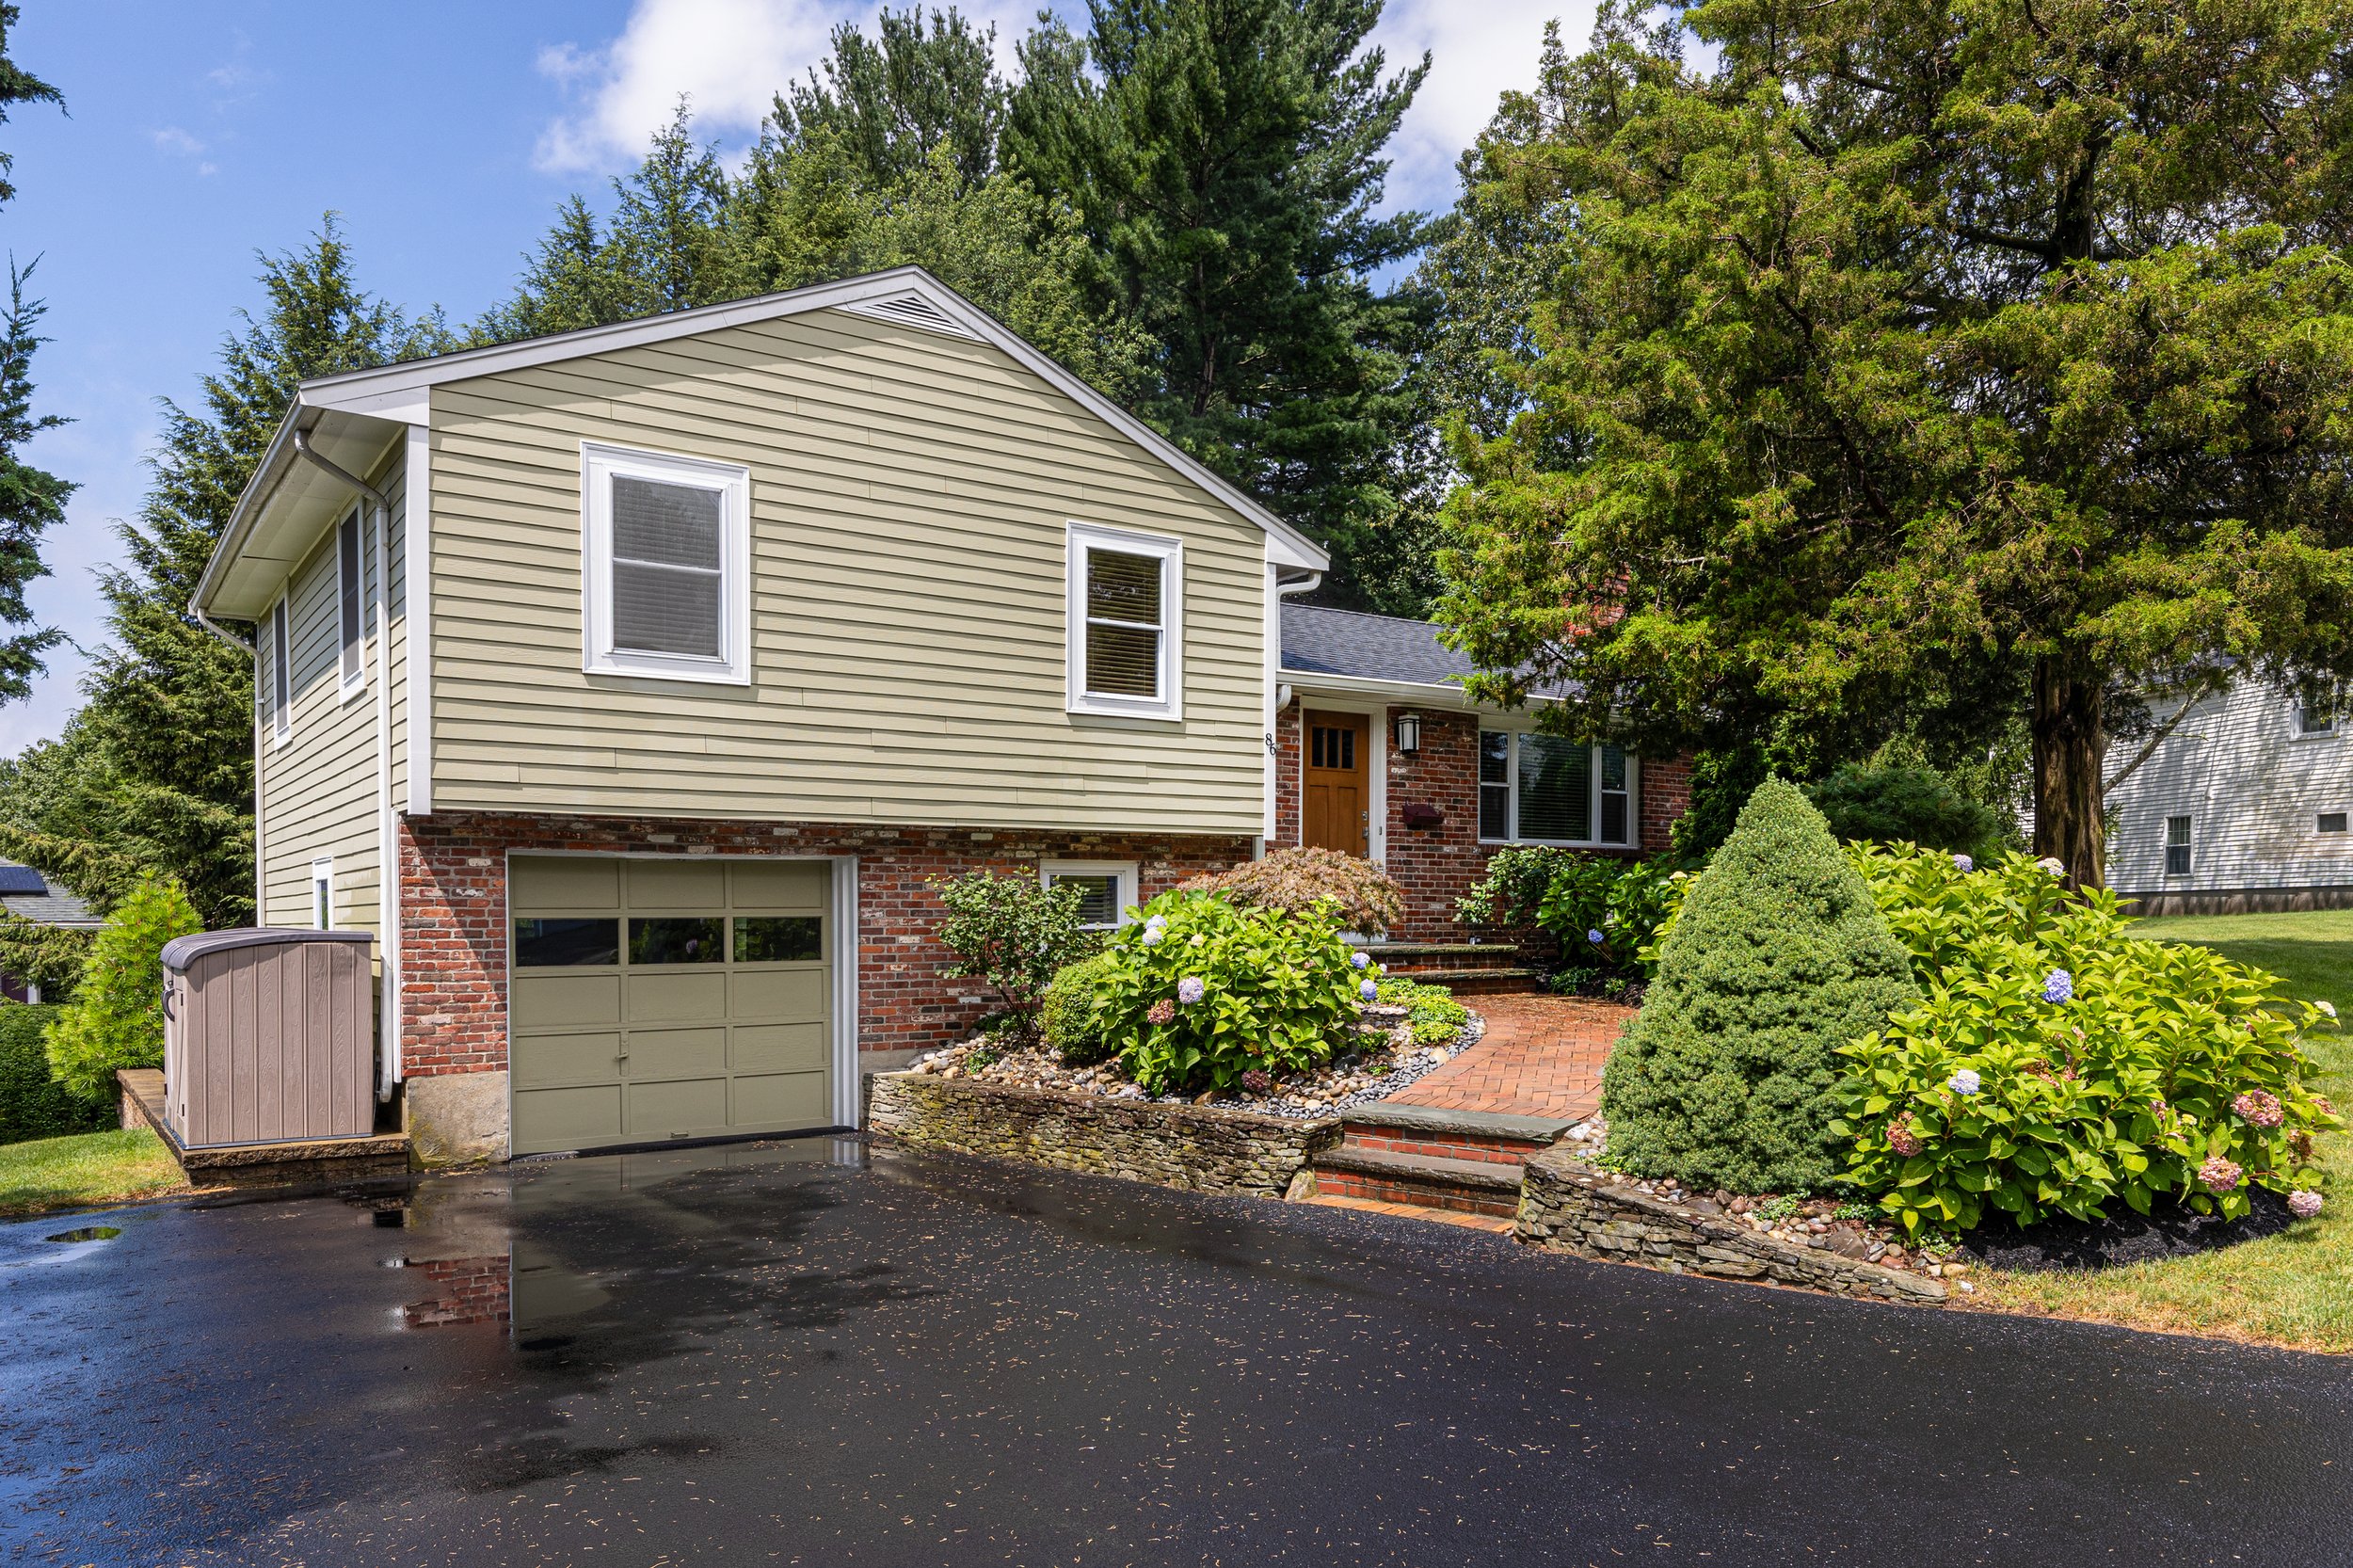
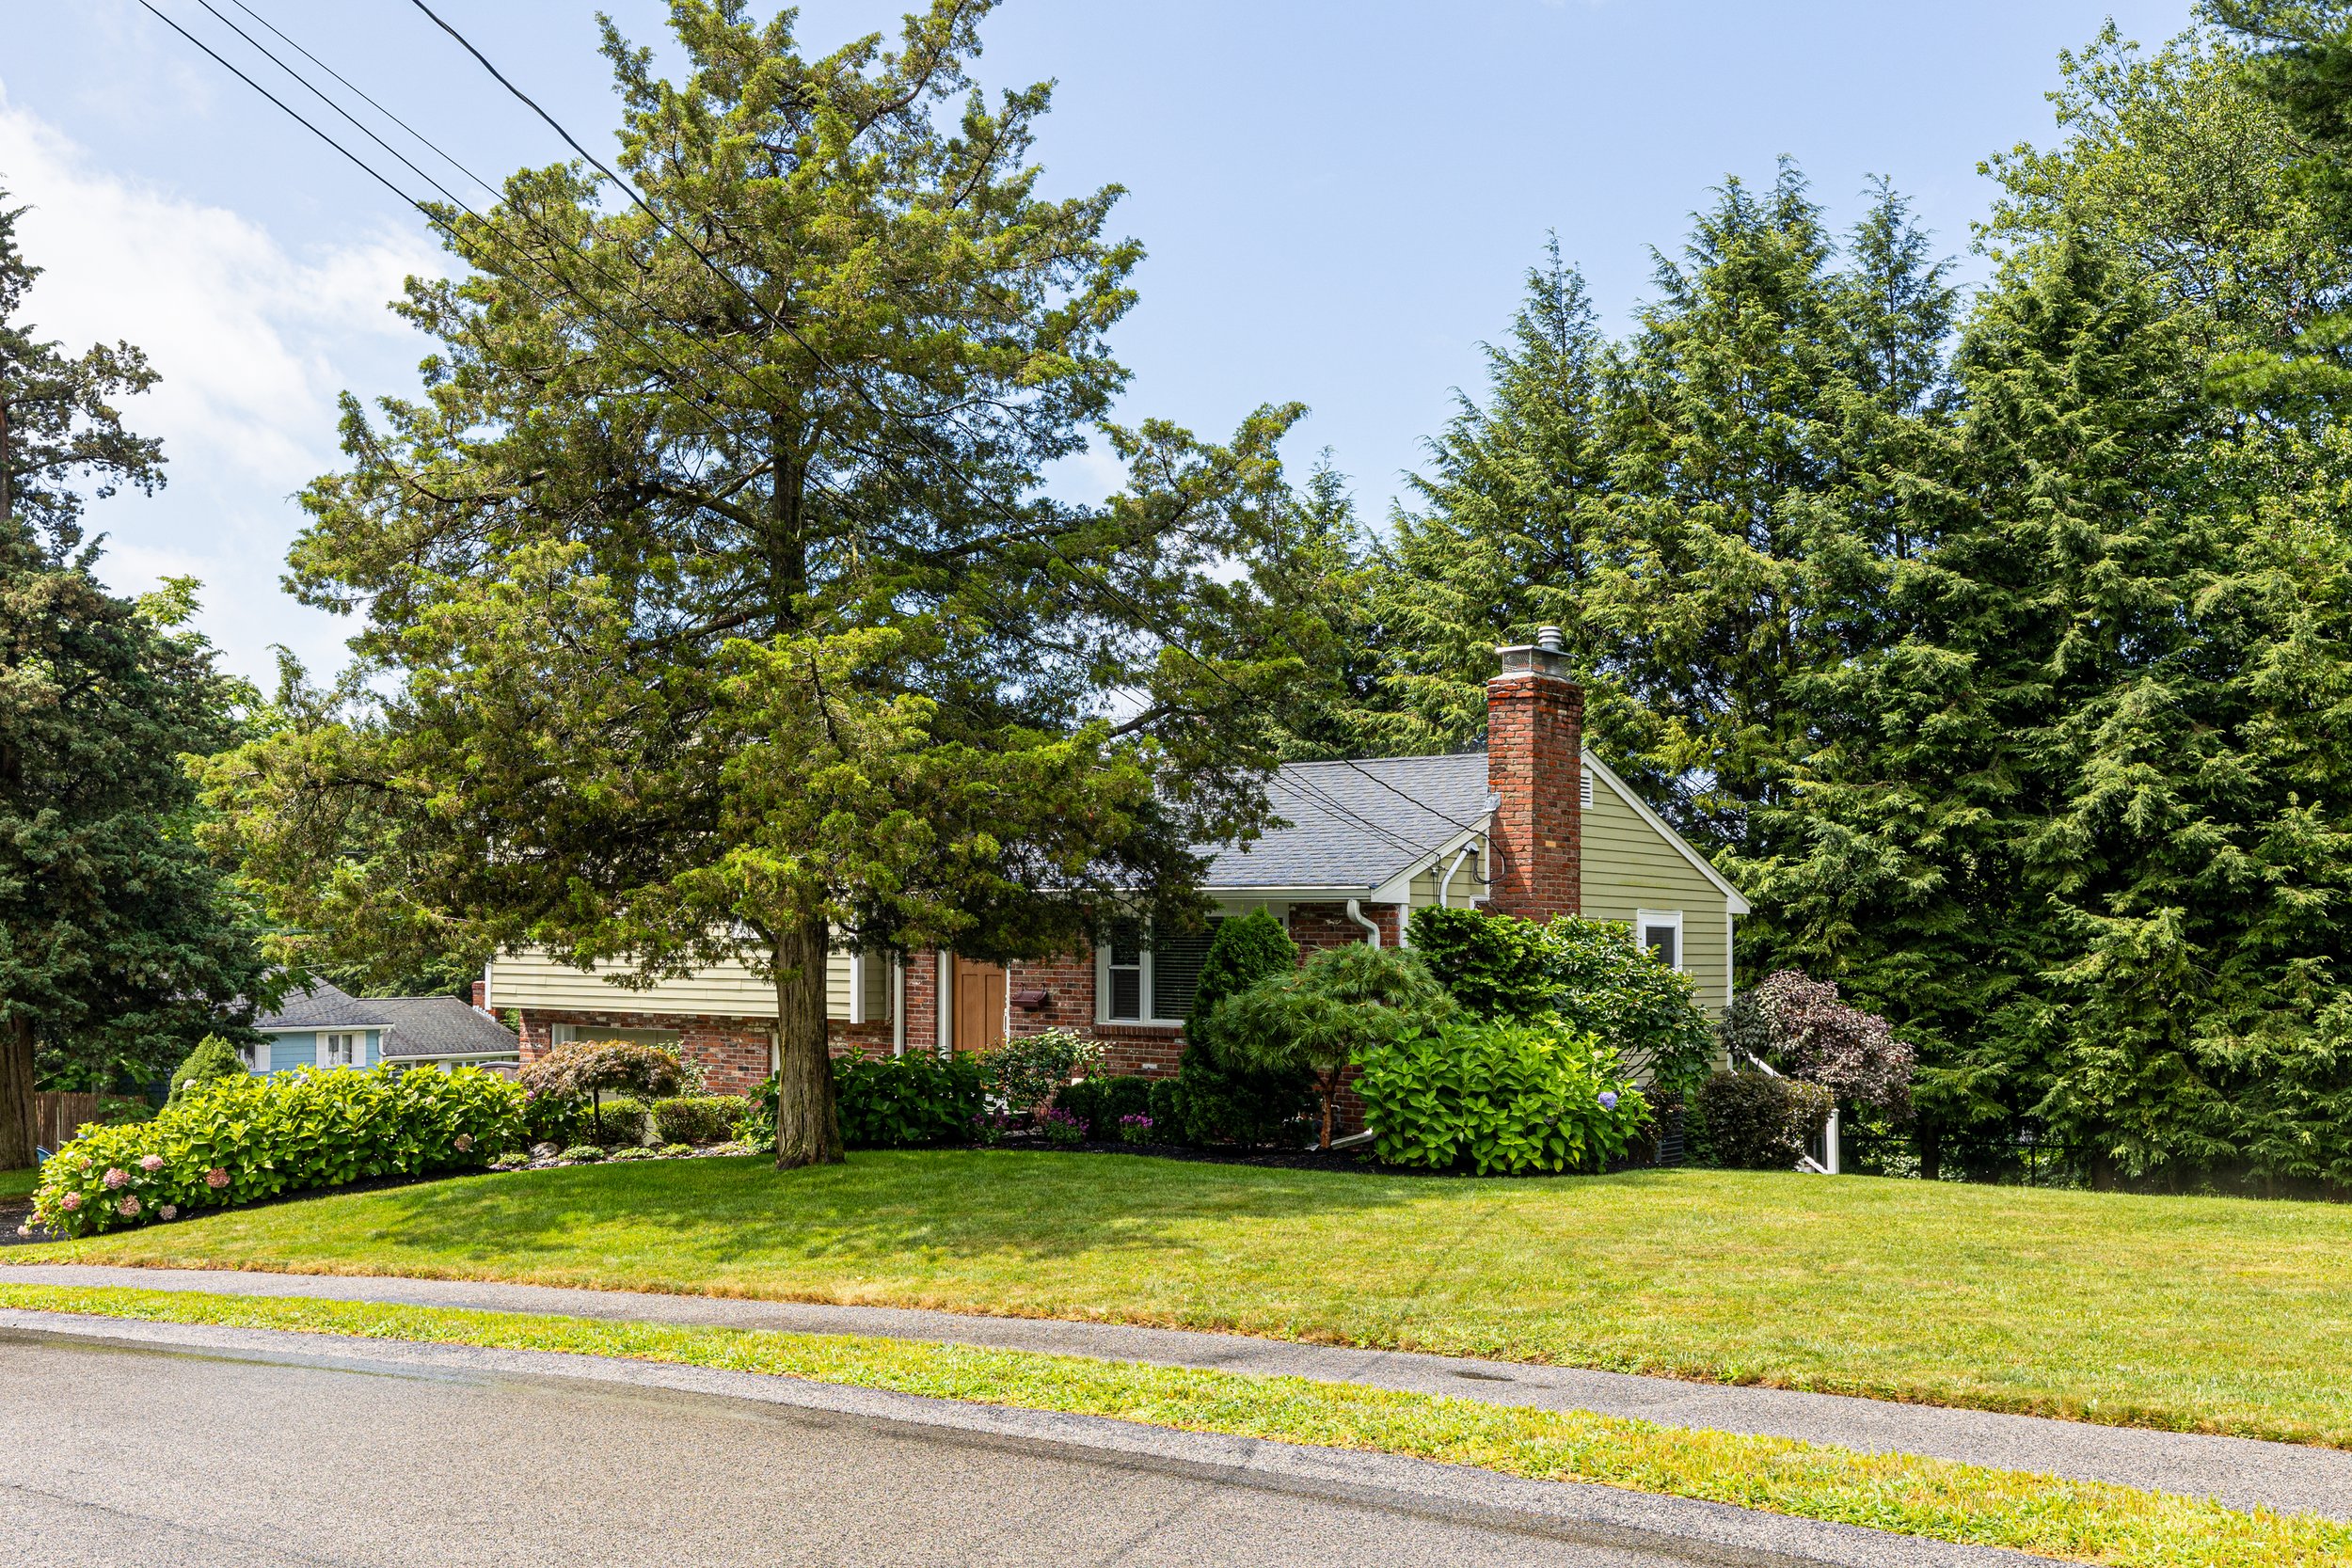
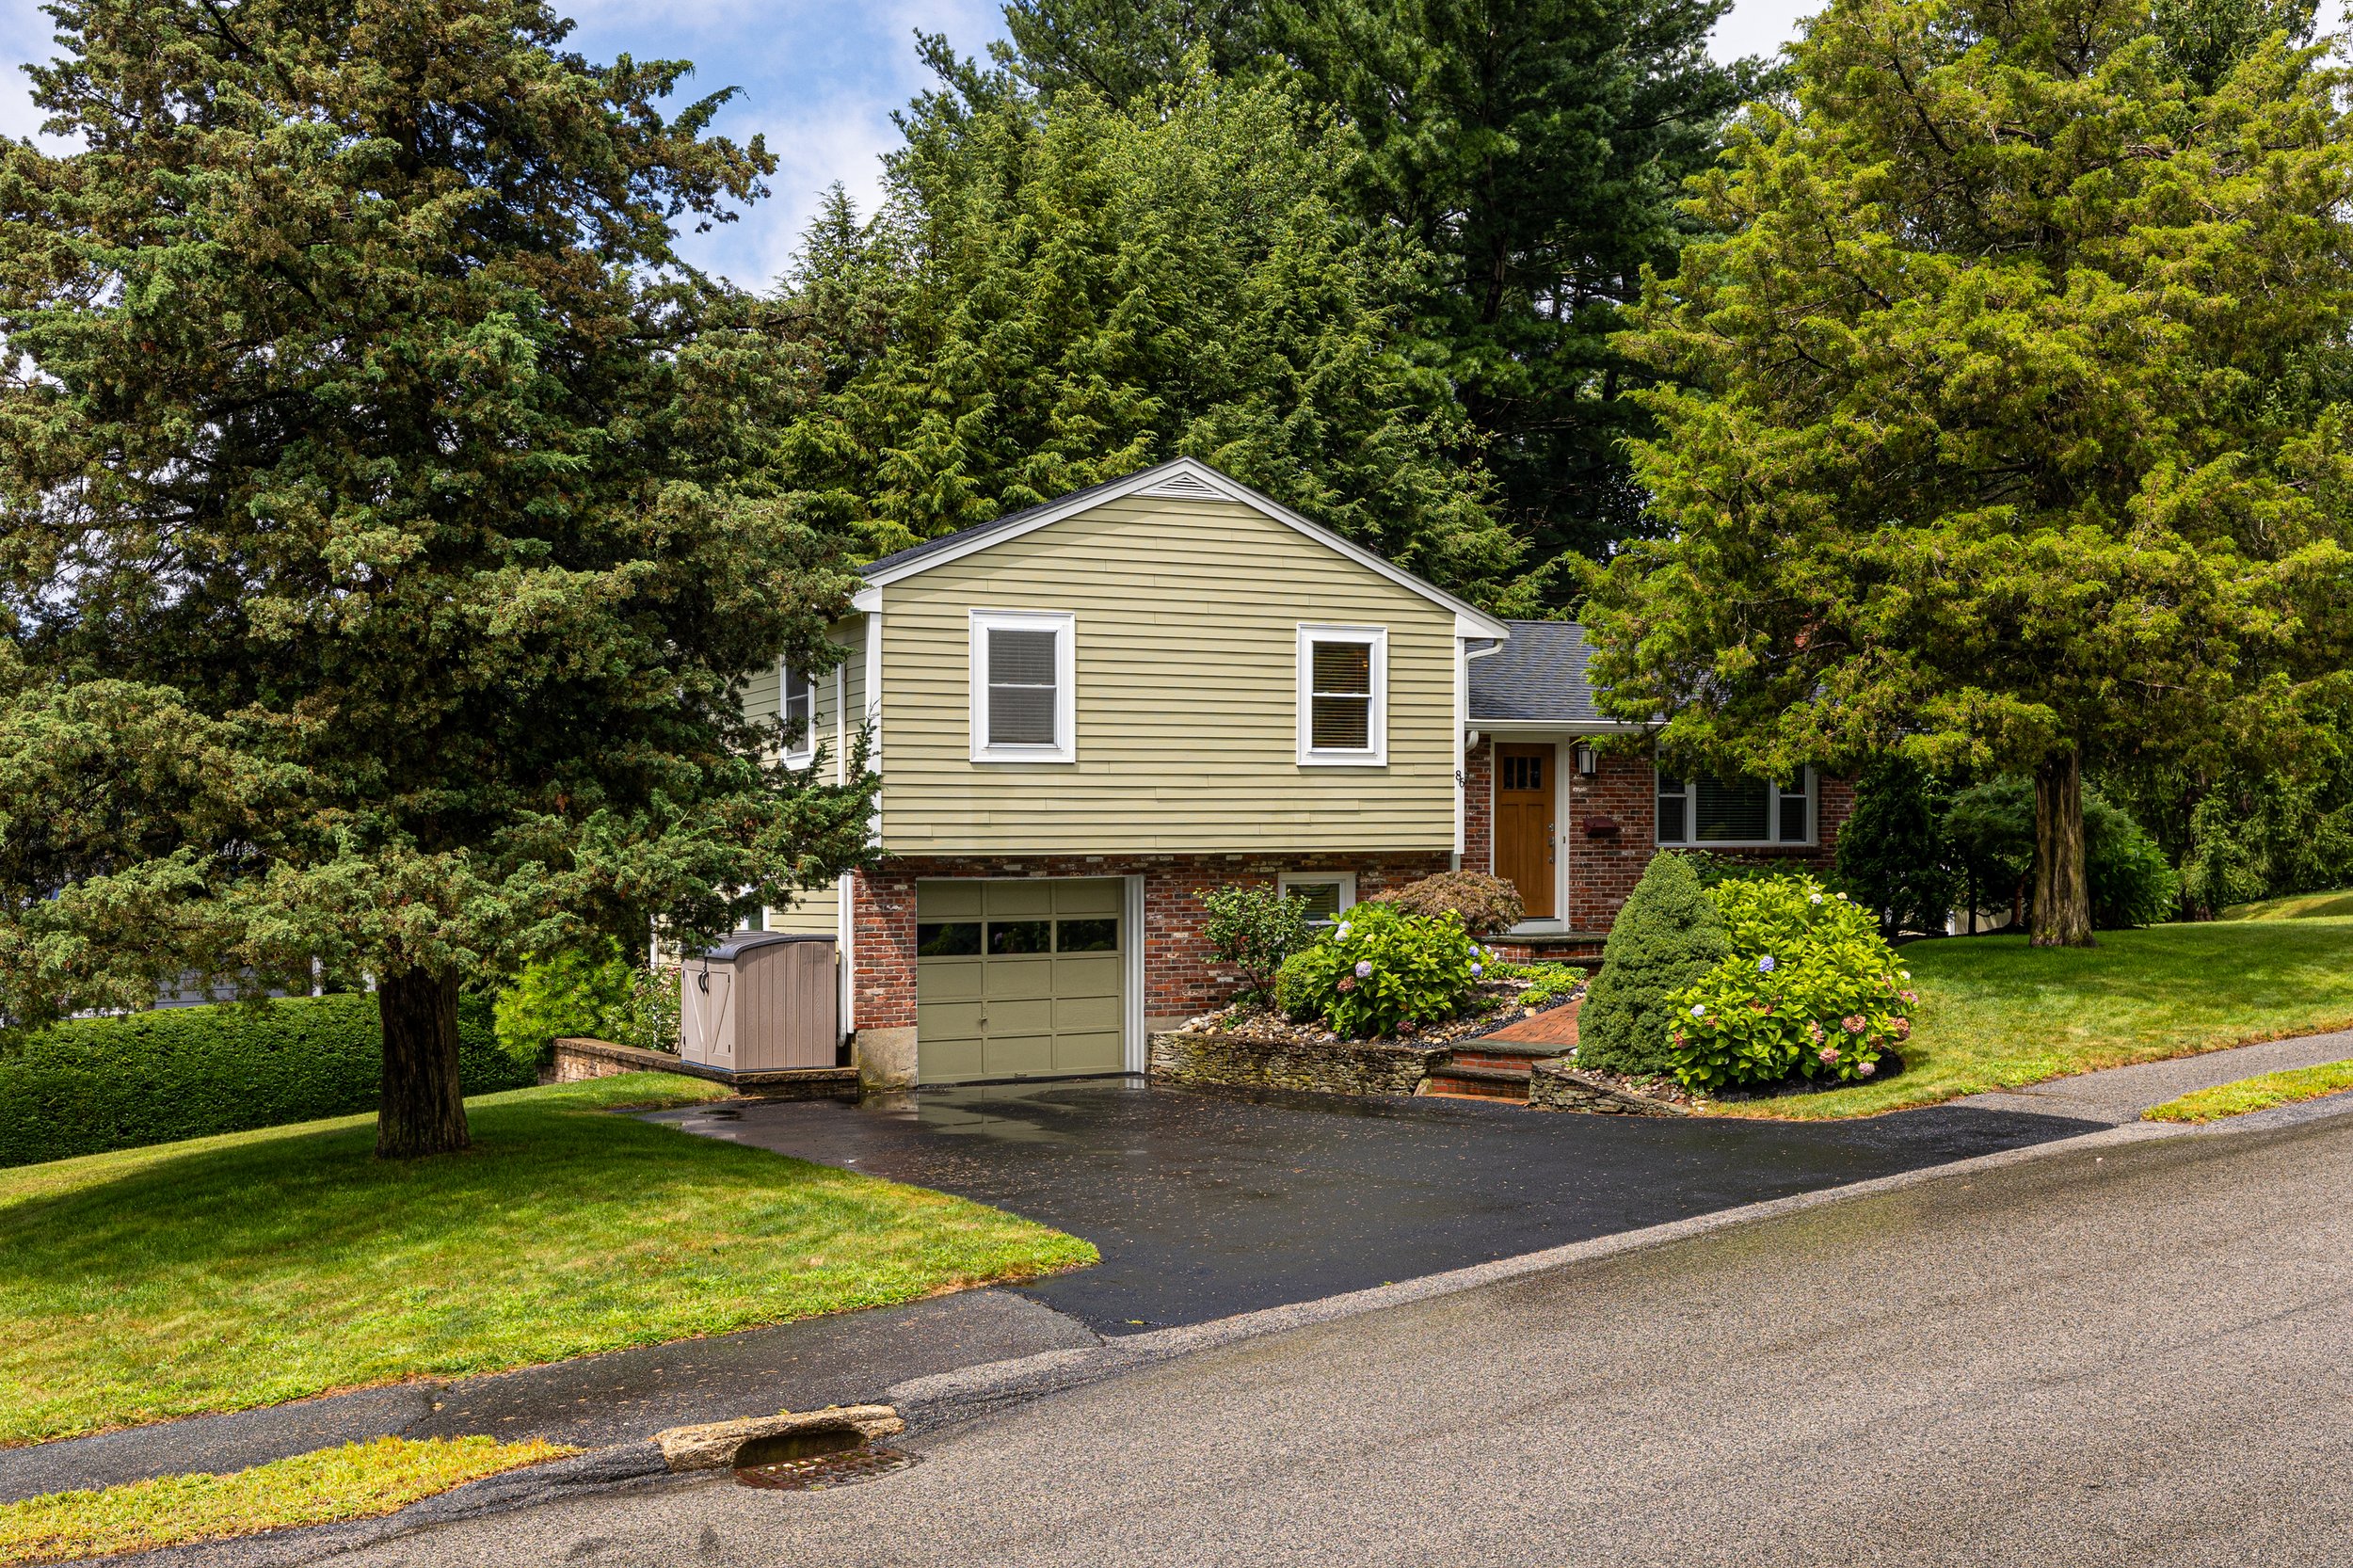
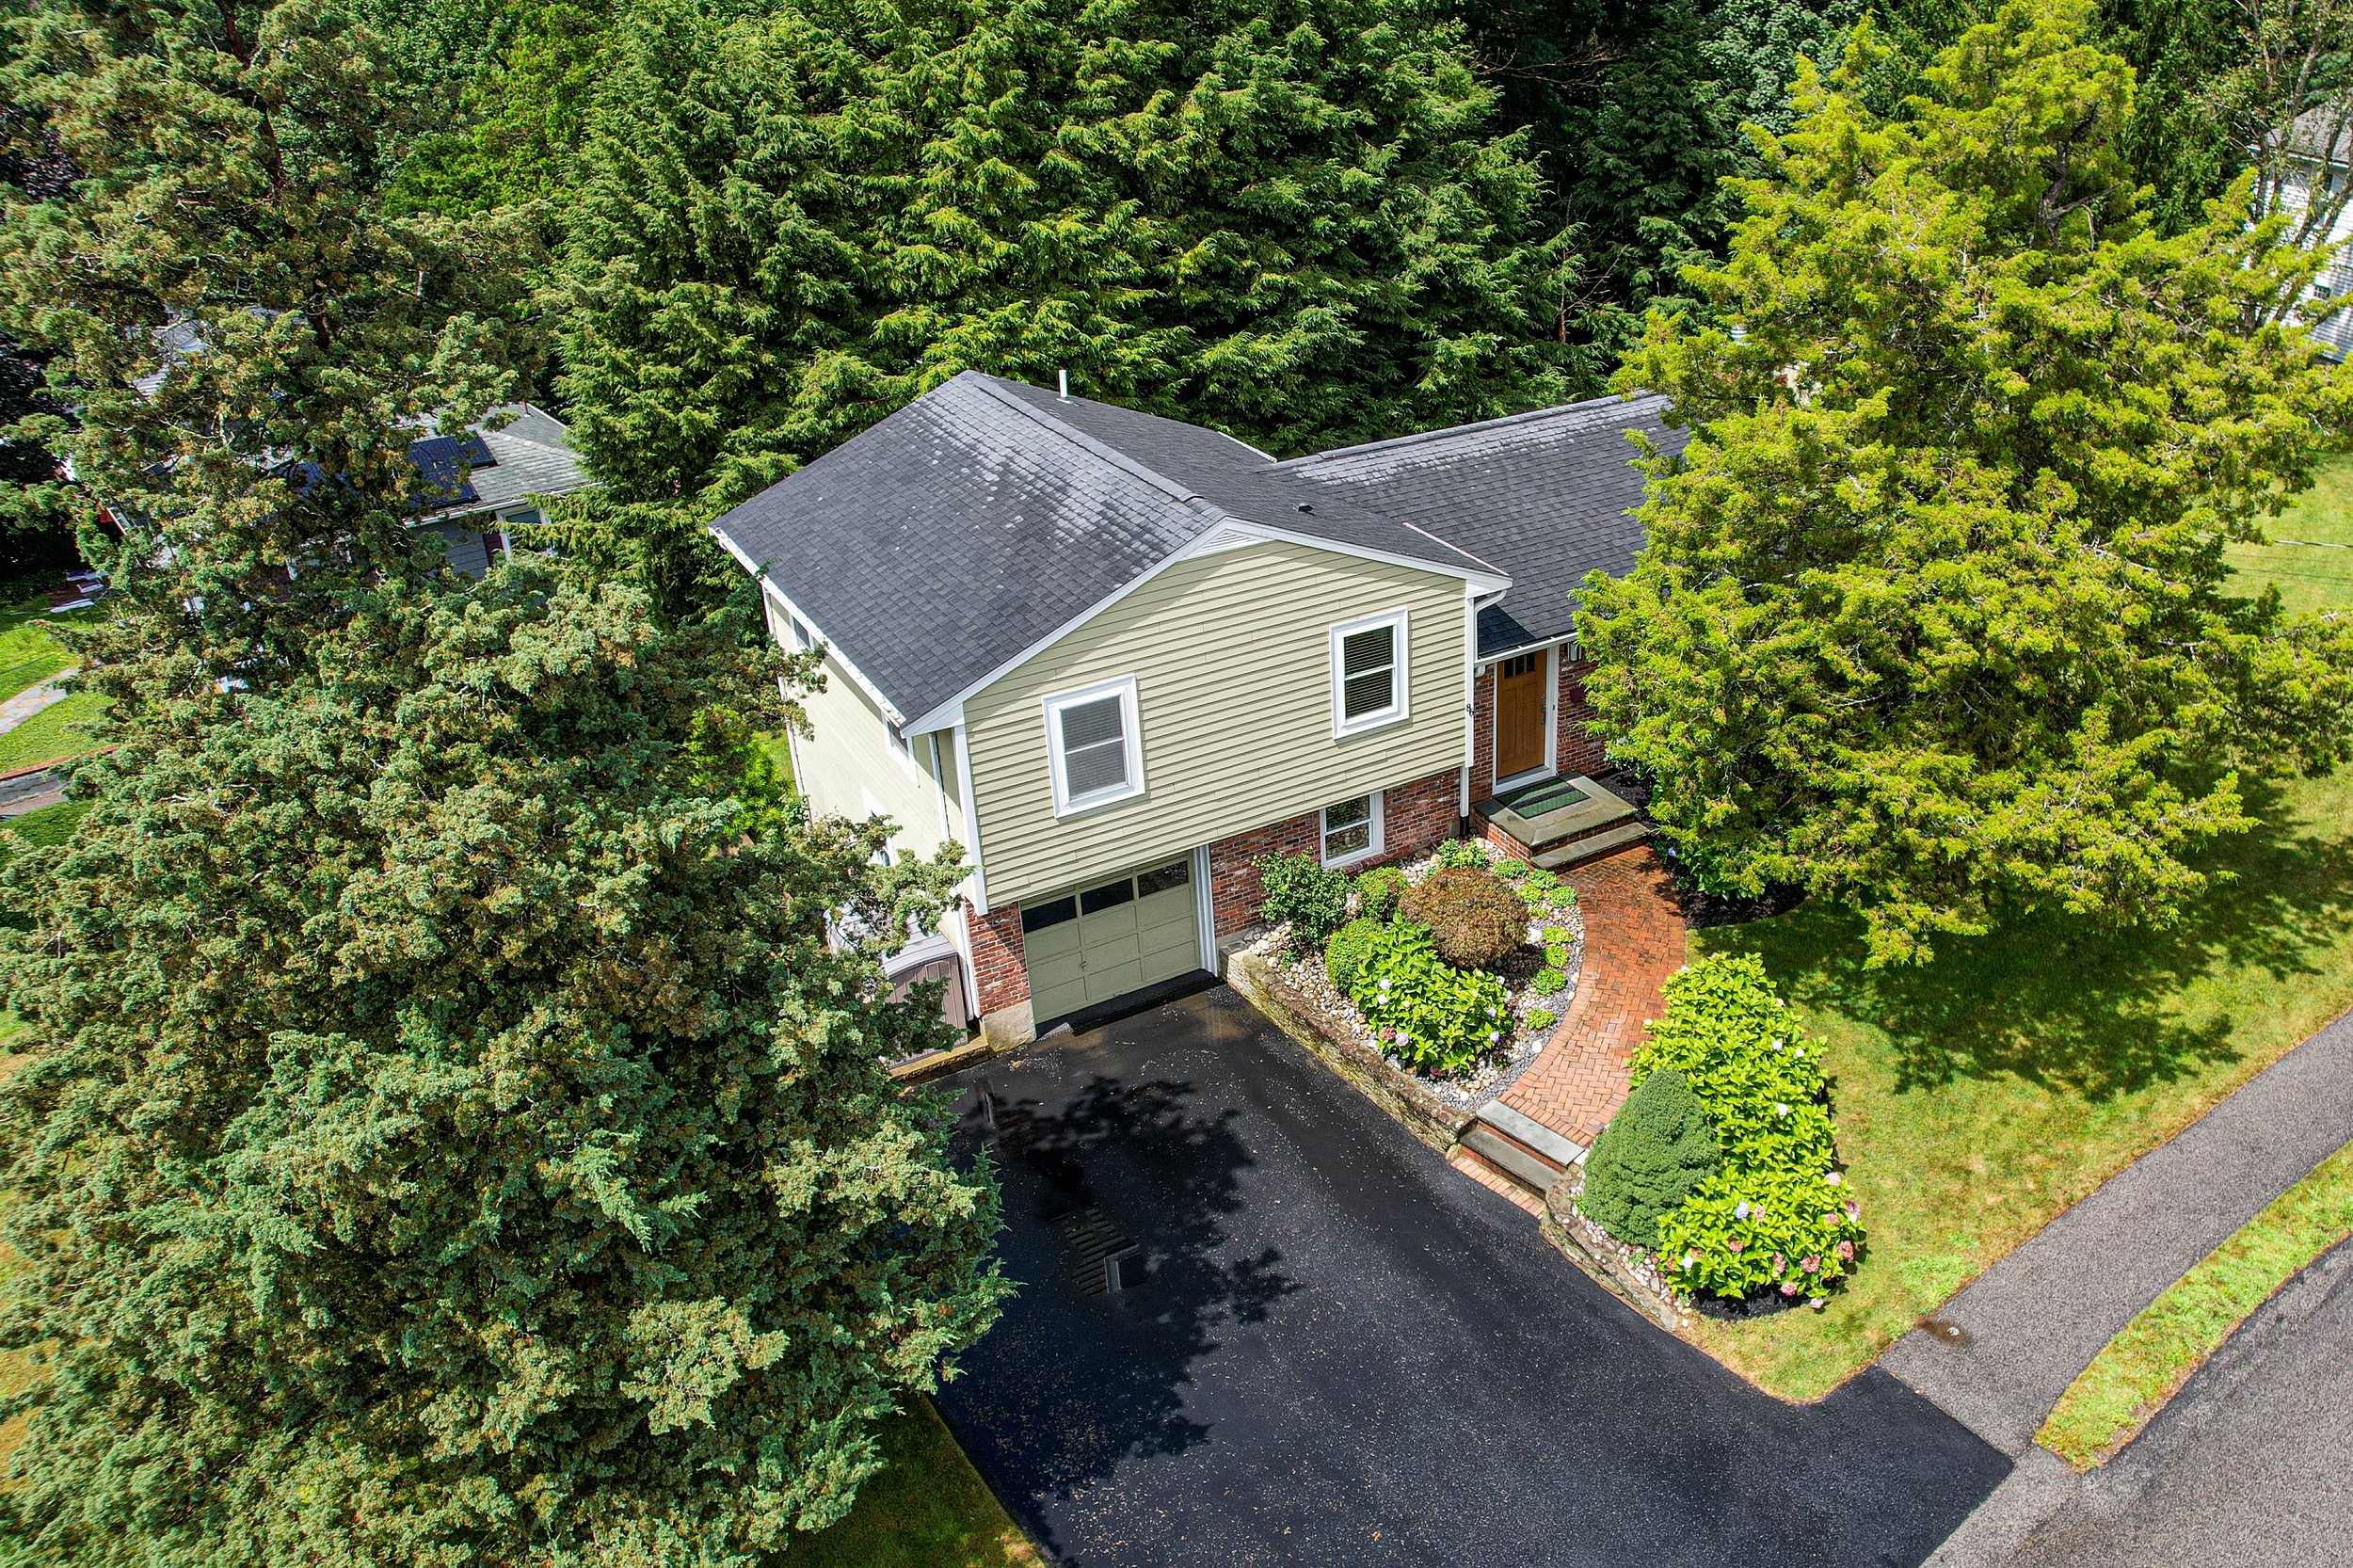
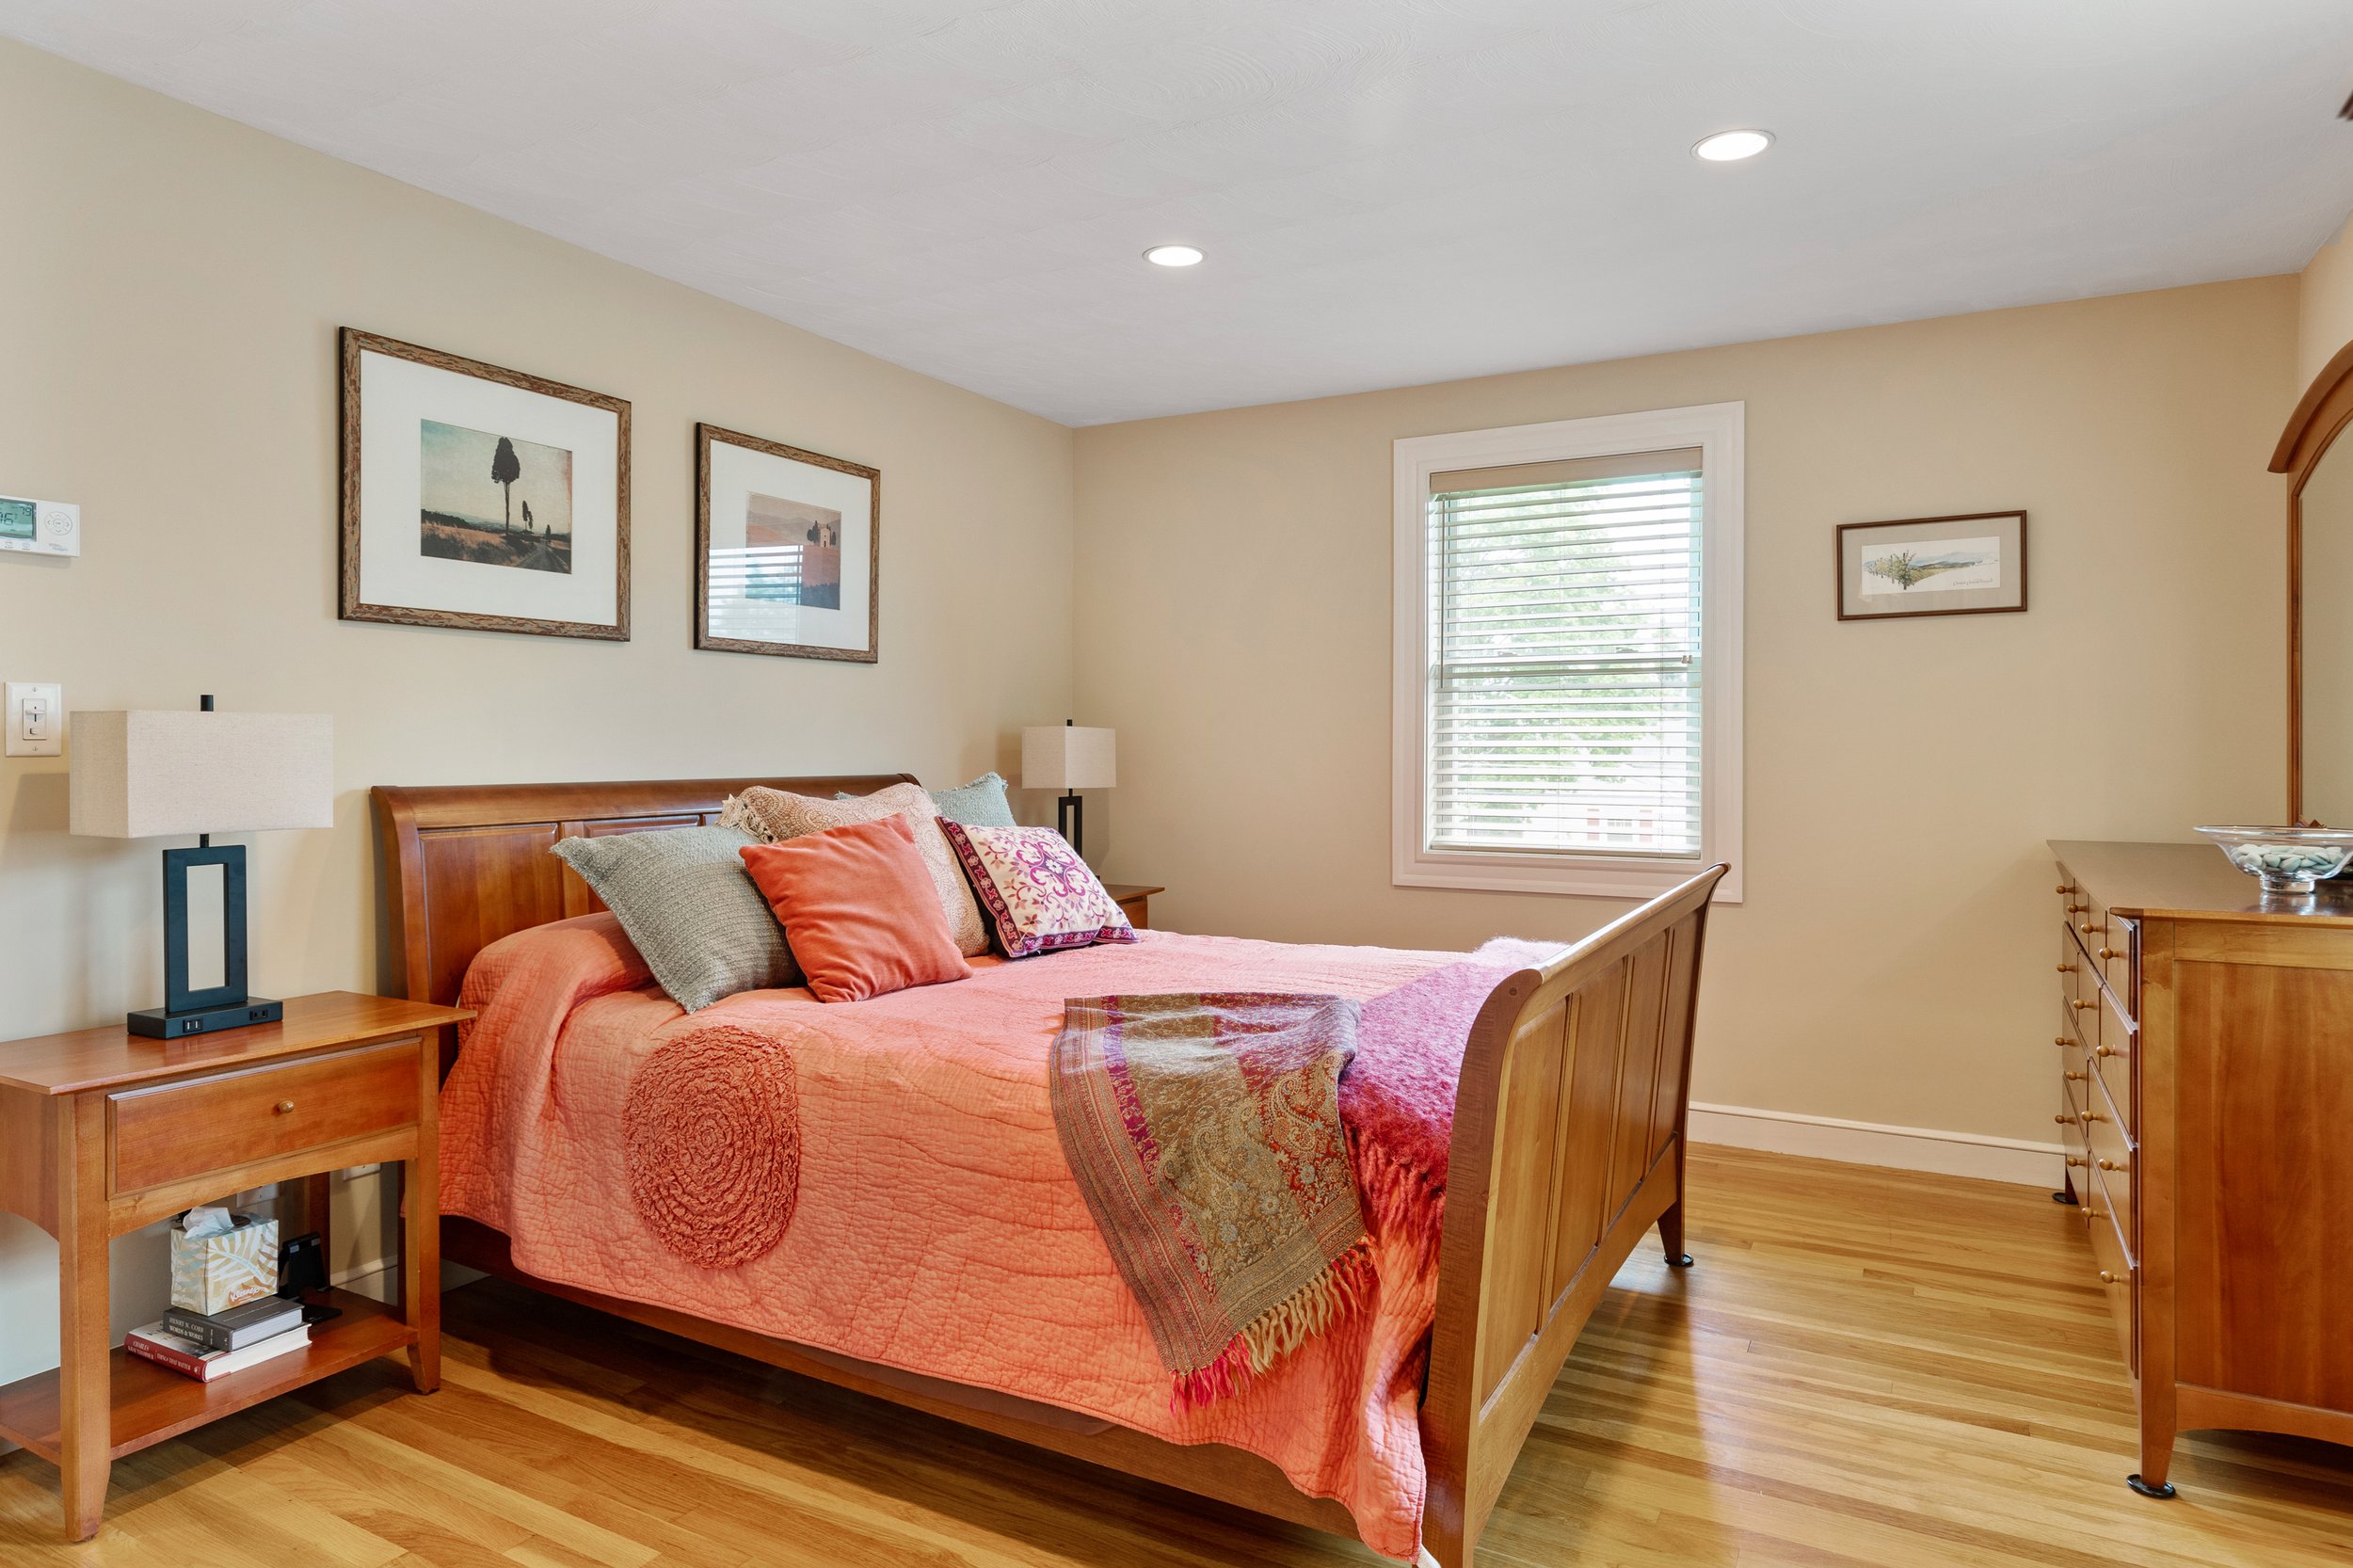
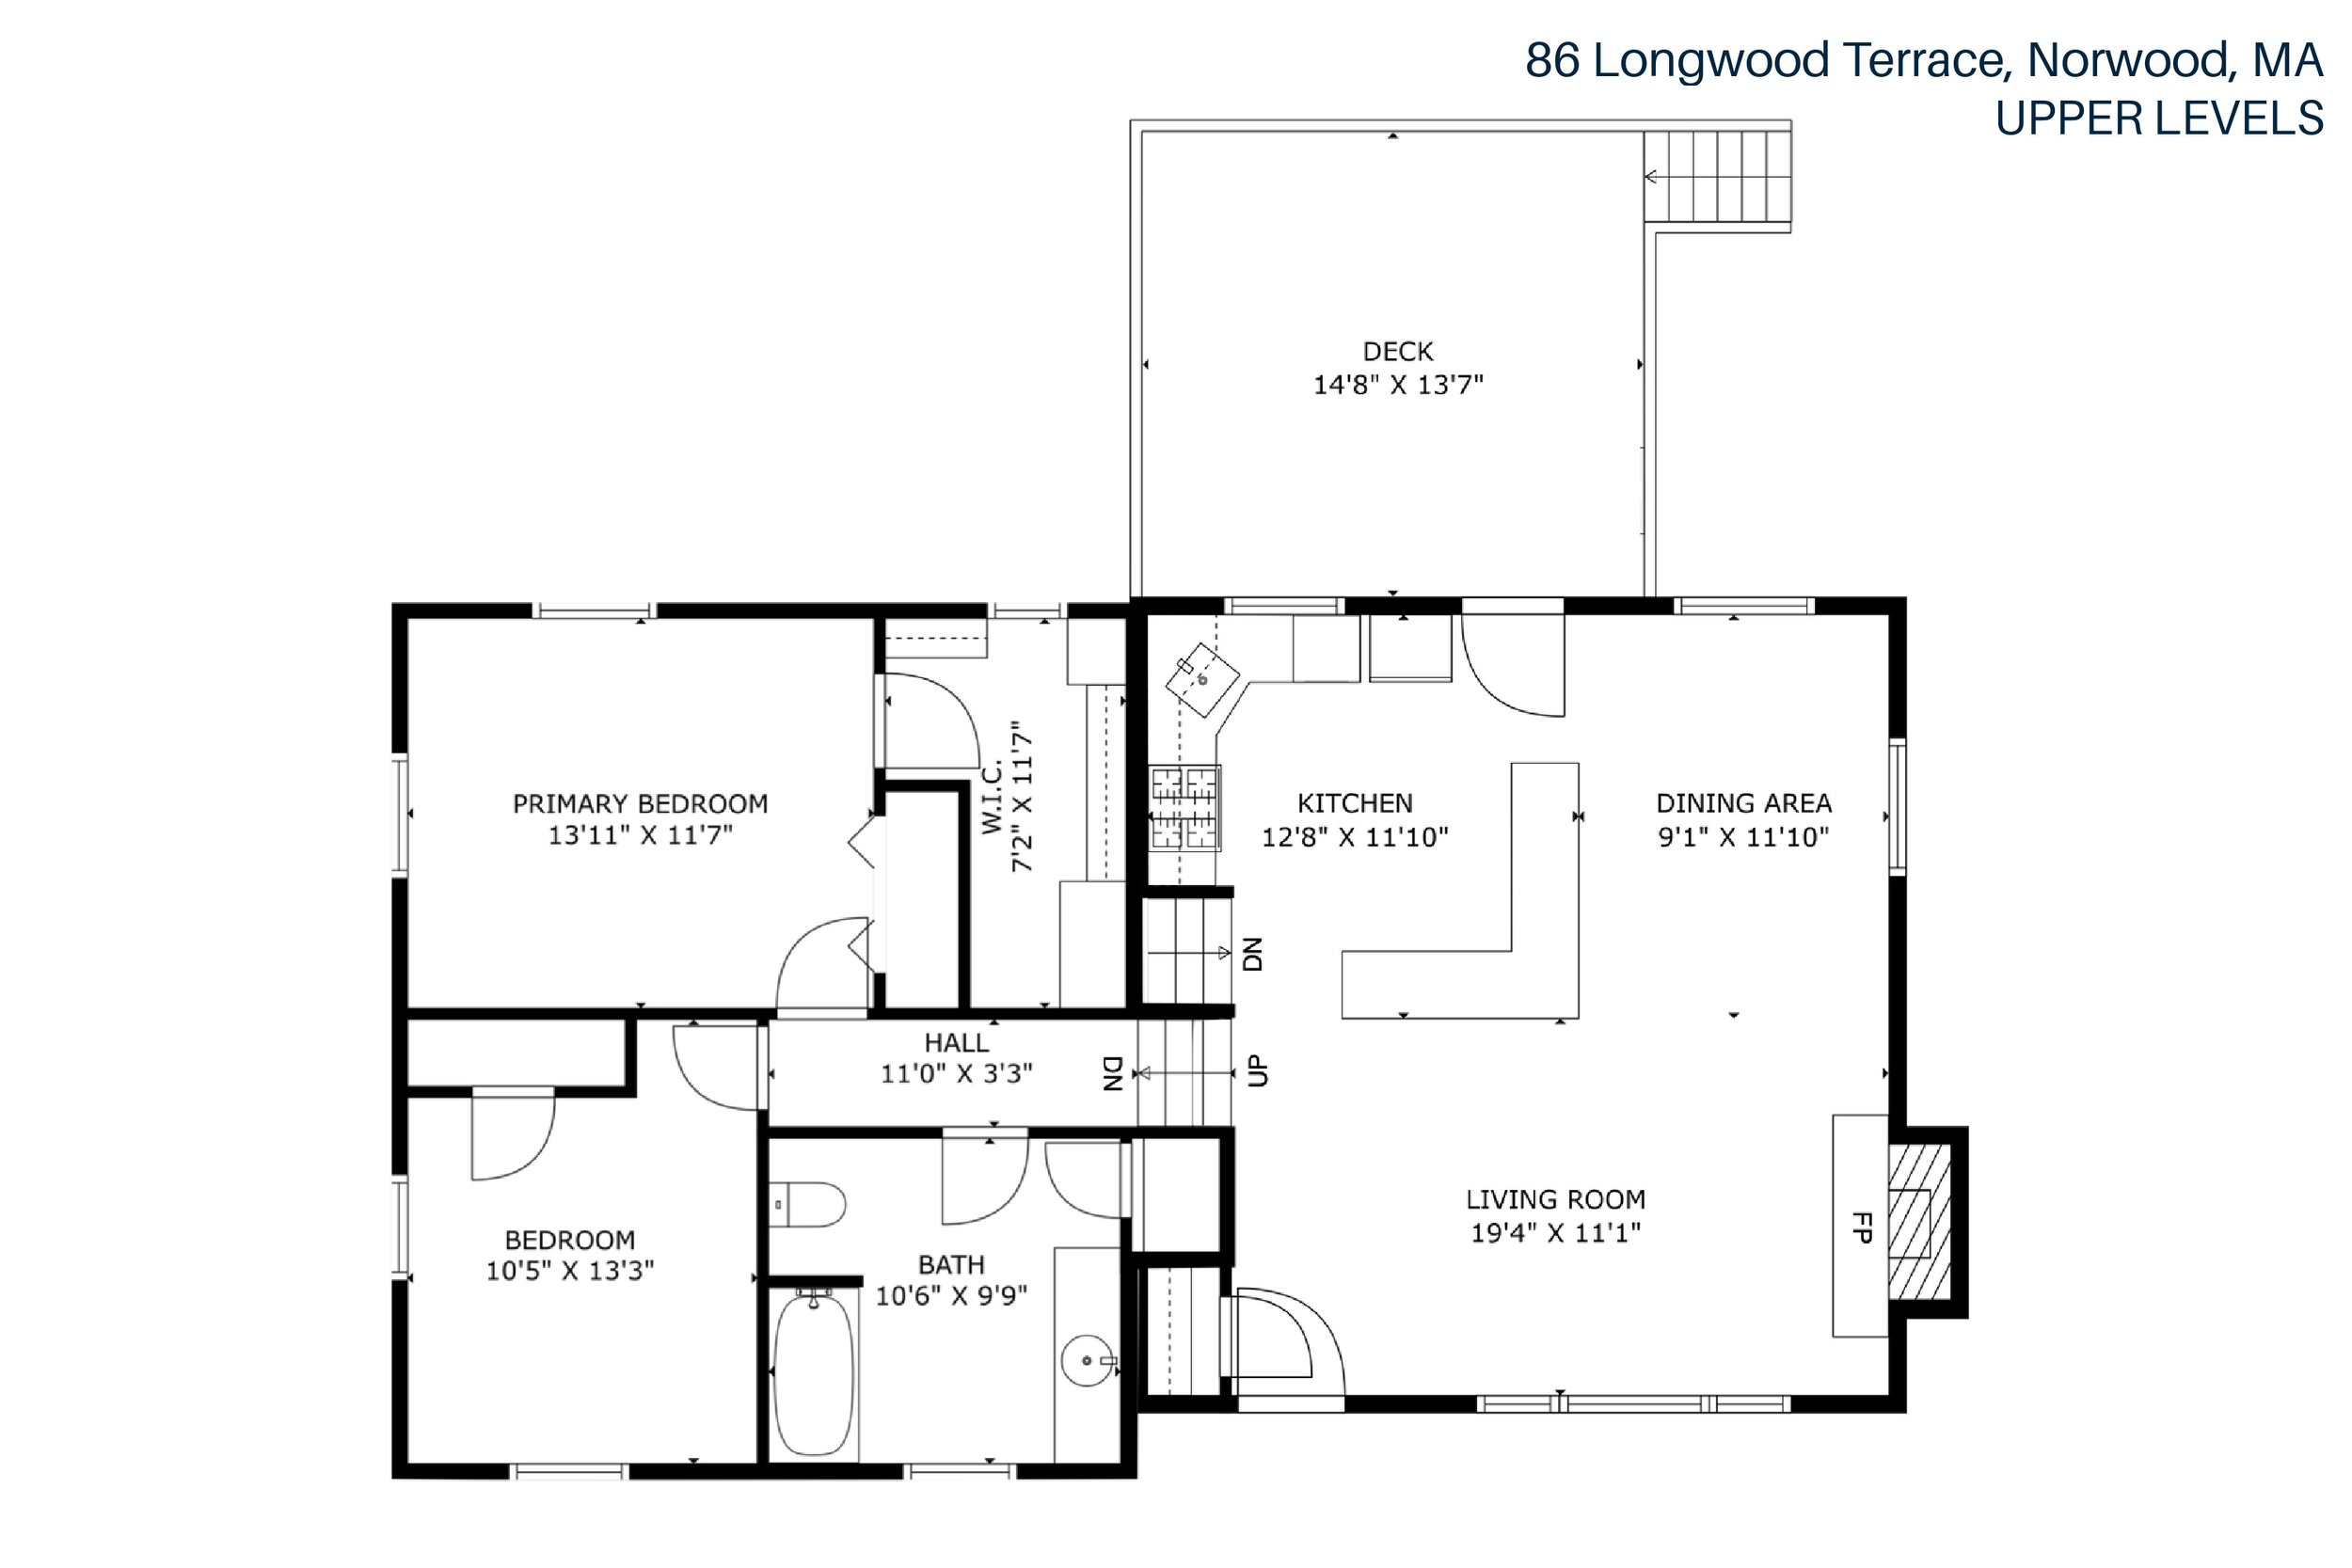
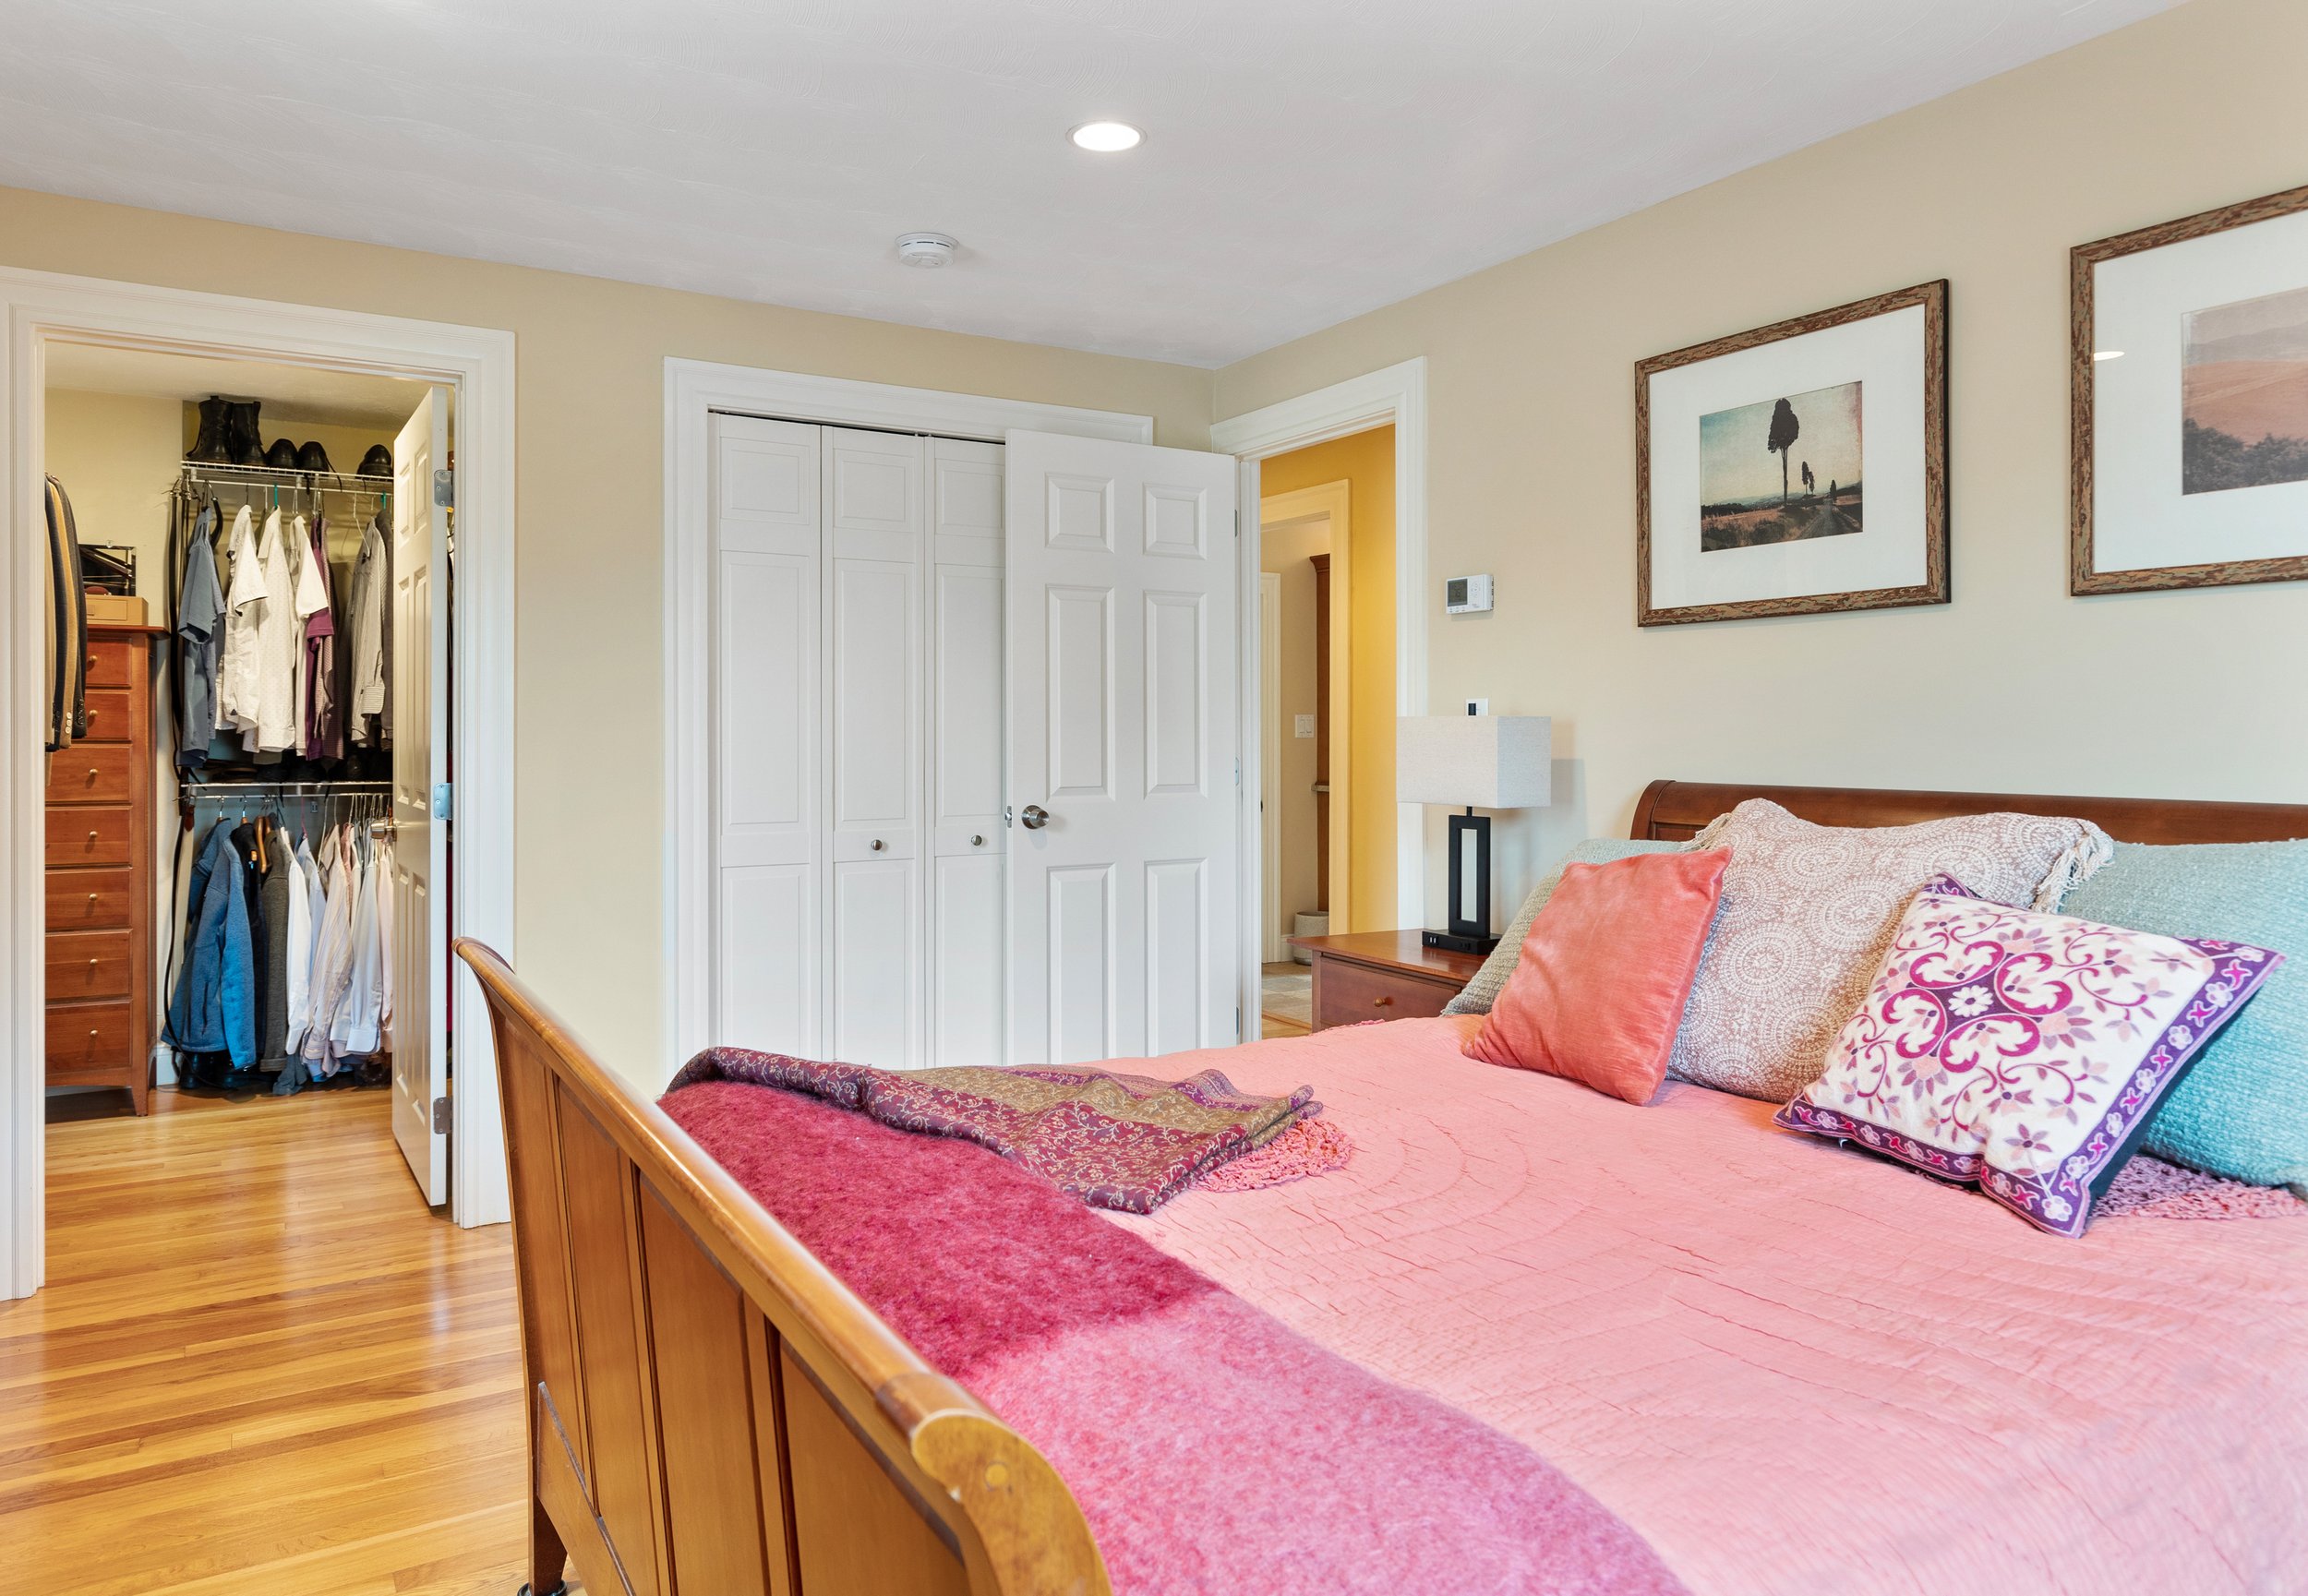
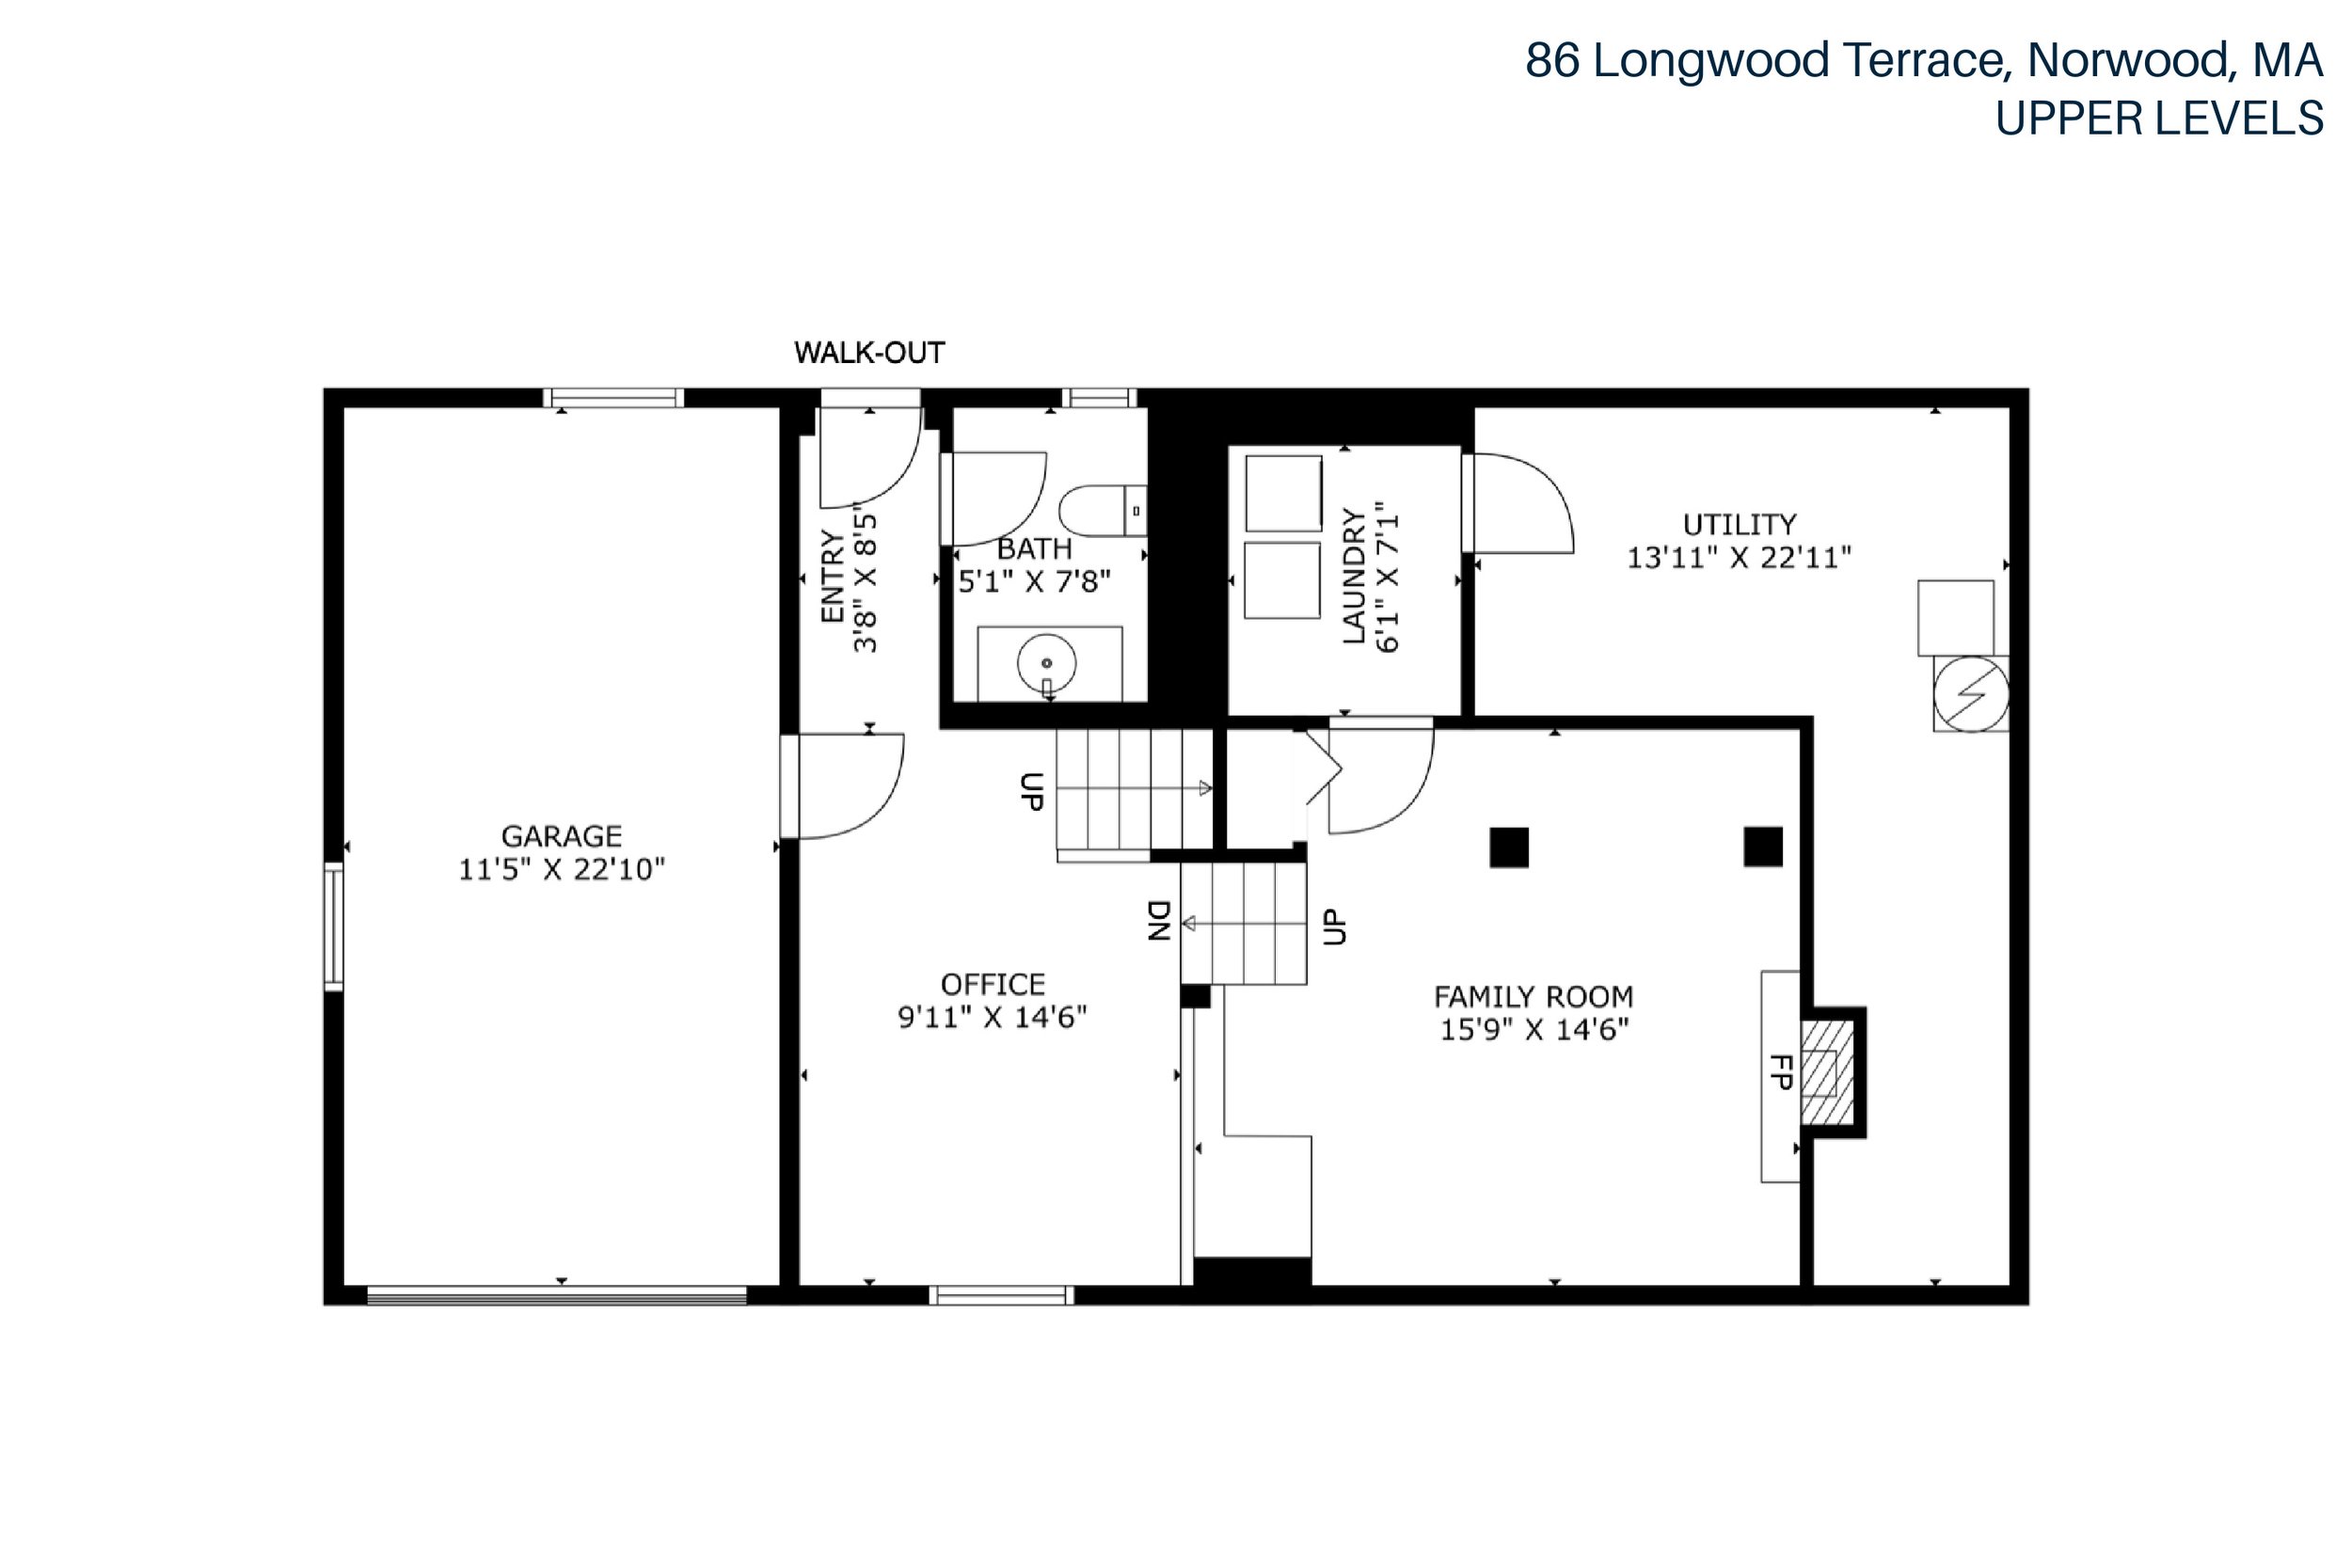
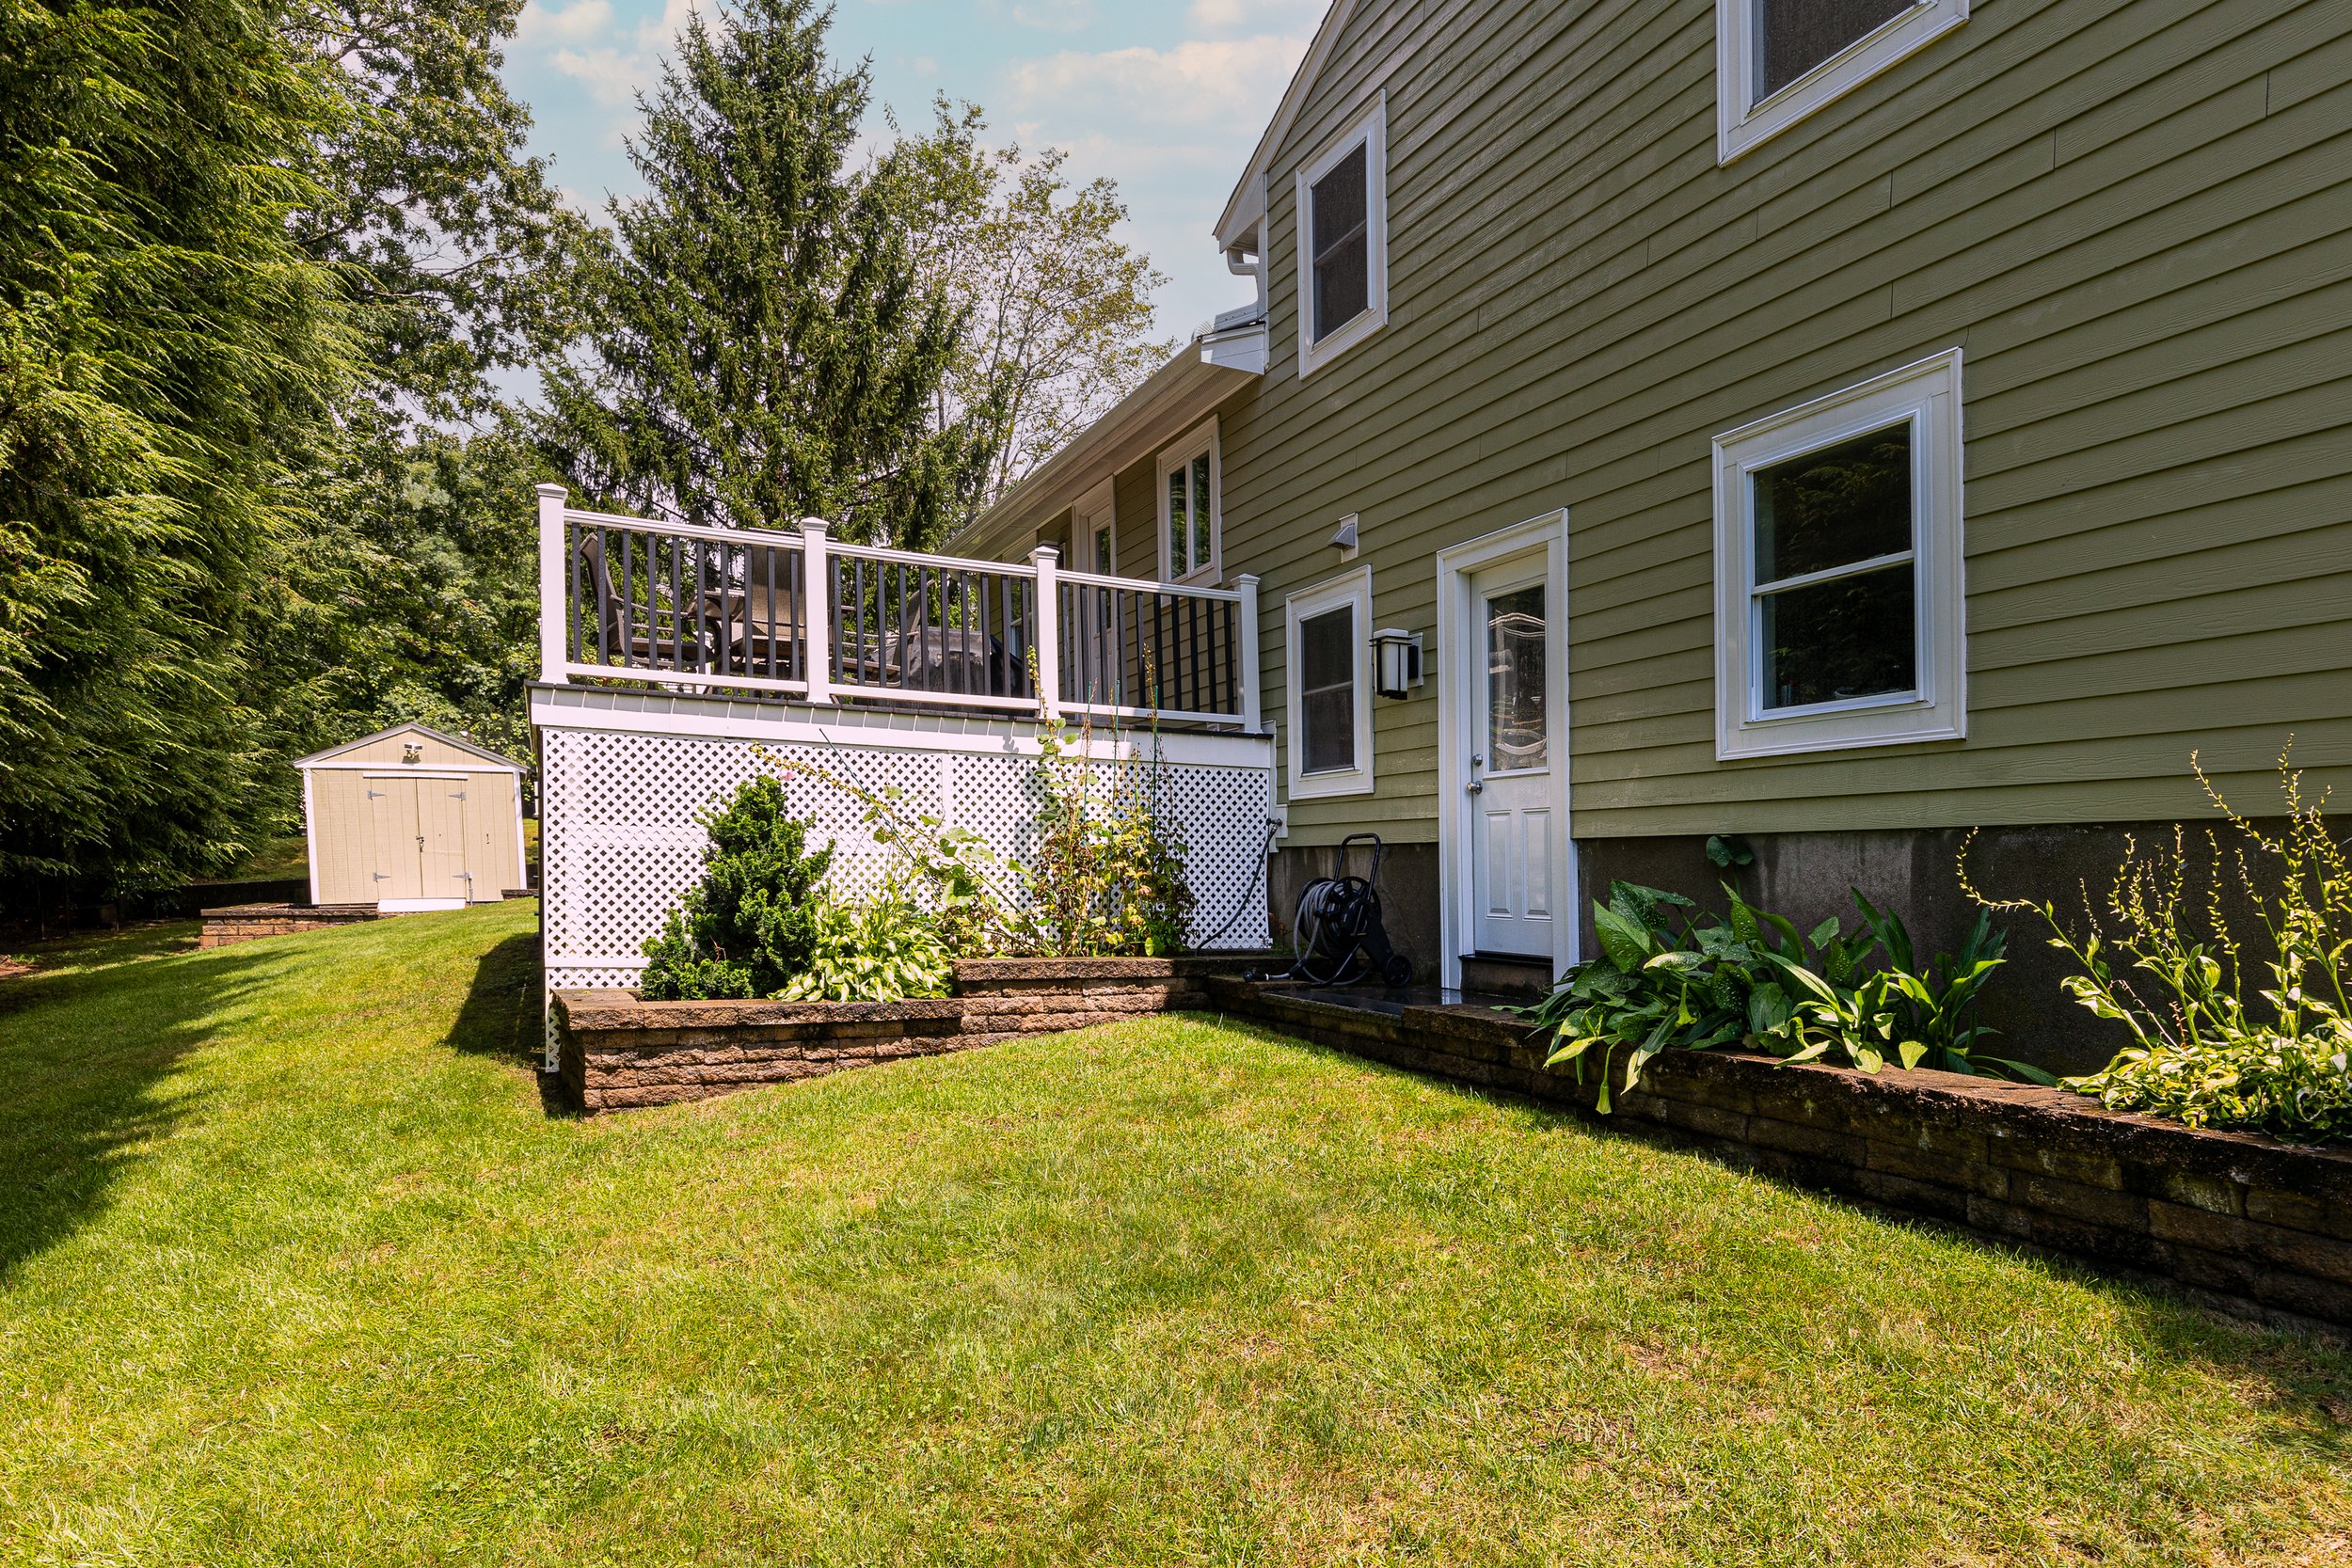
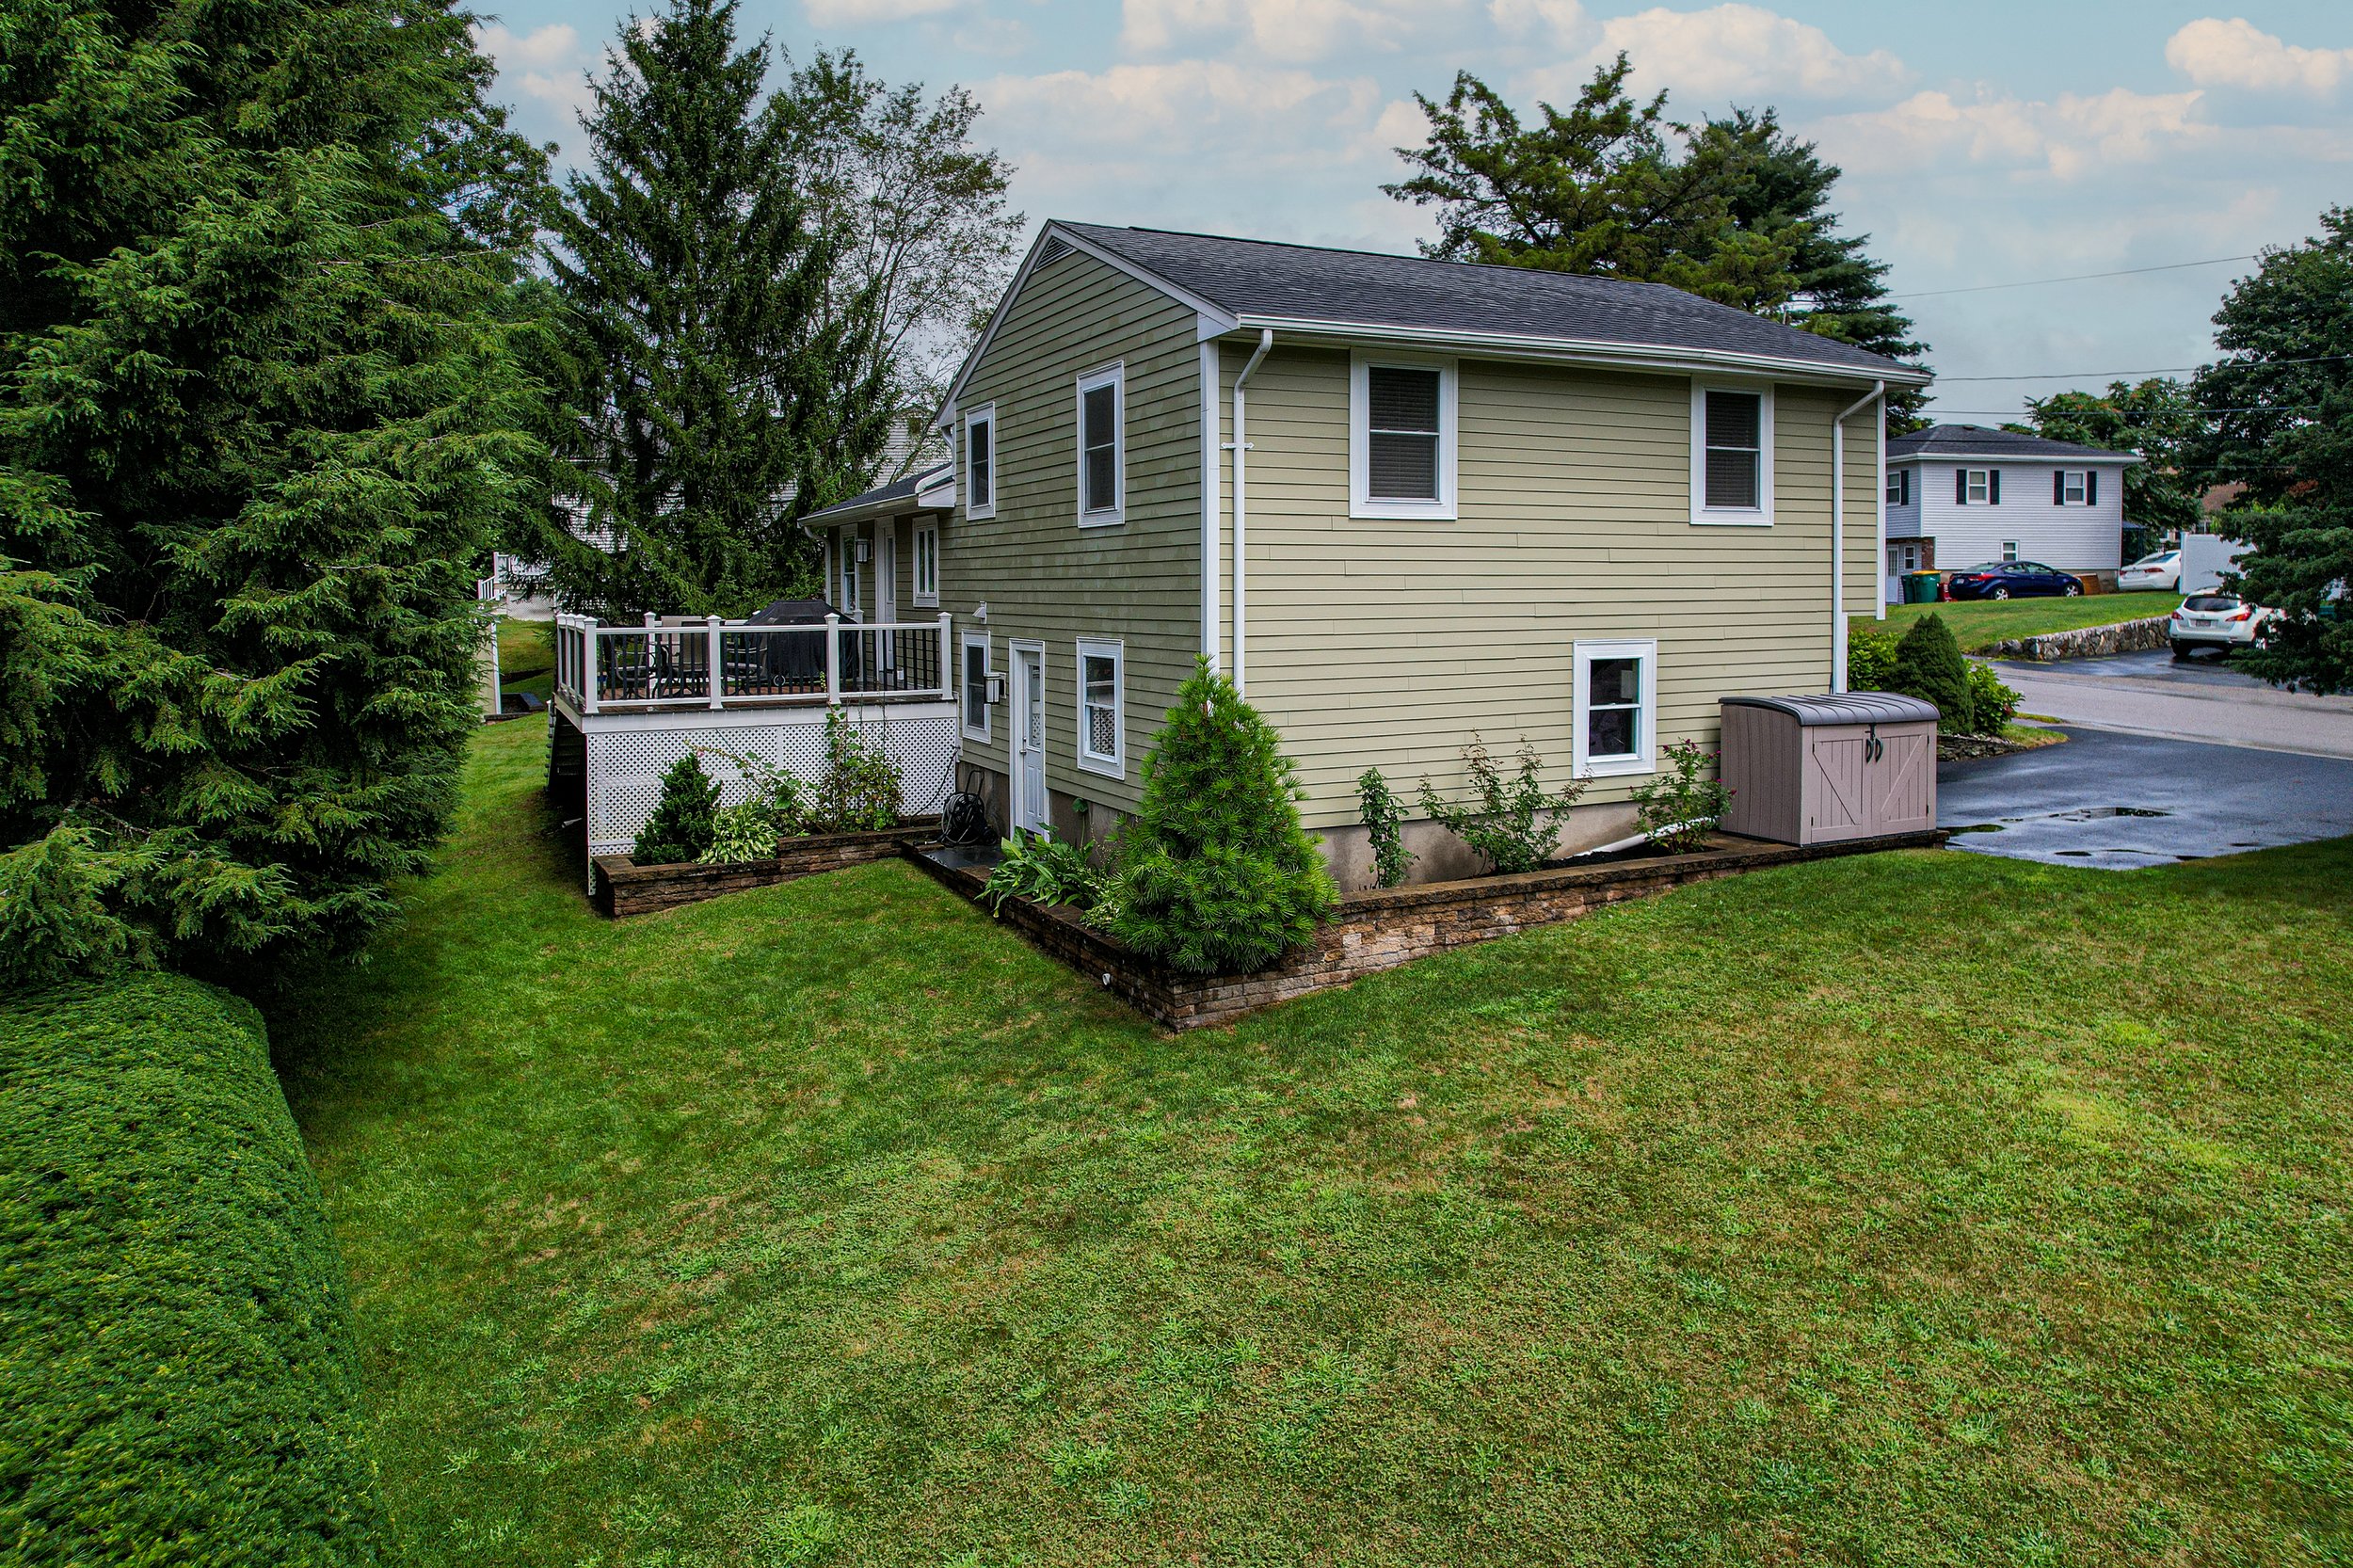
86 Longwood Terrace, Norwood, MA 02062
SoLD!
2 beds | 1.5 baths | 1,832 sq.ft. | 0.29 acres
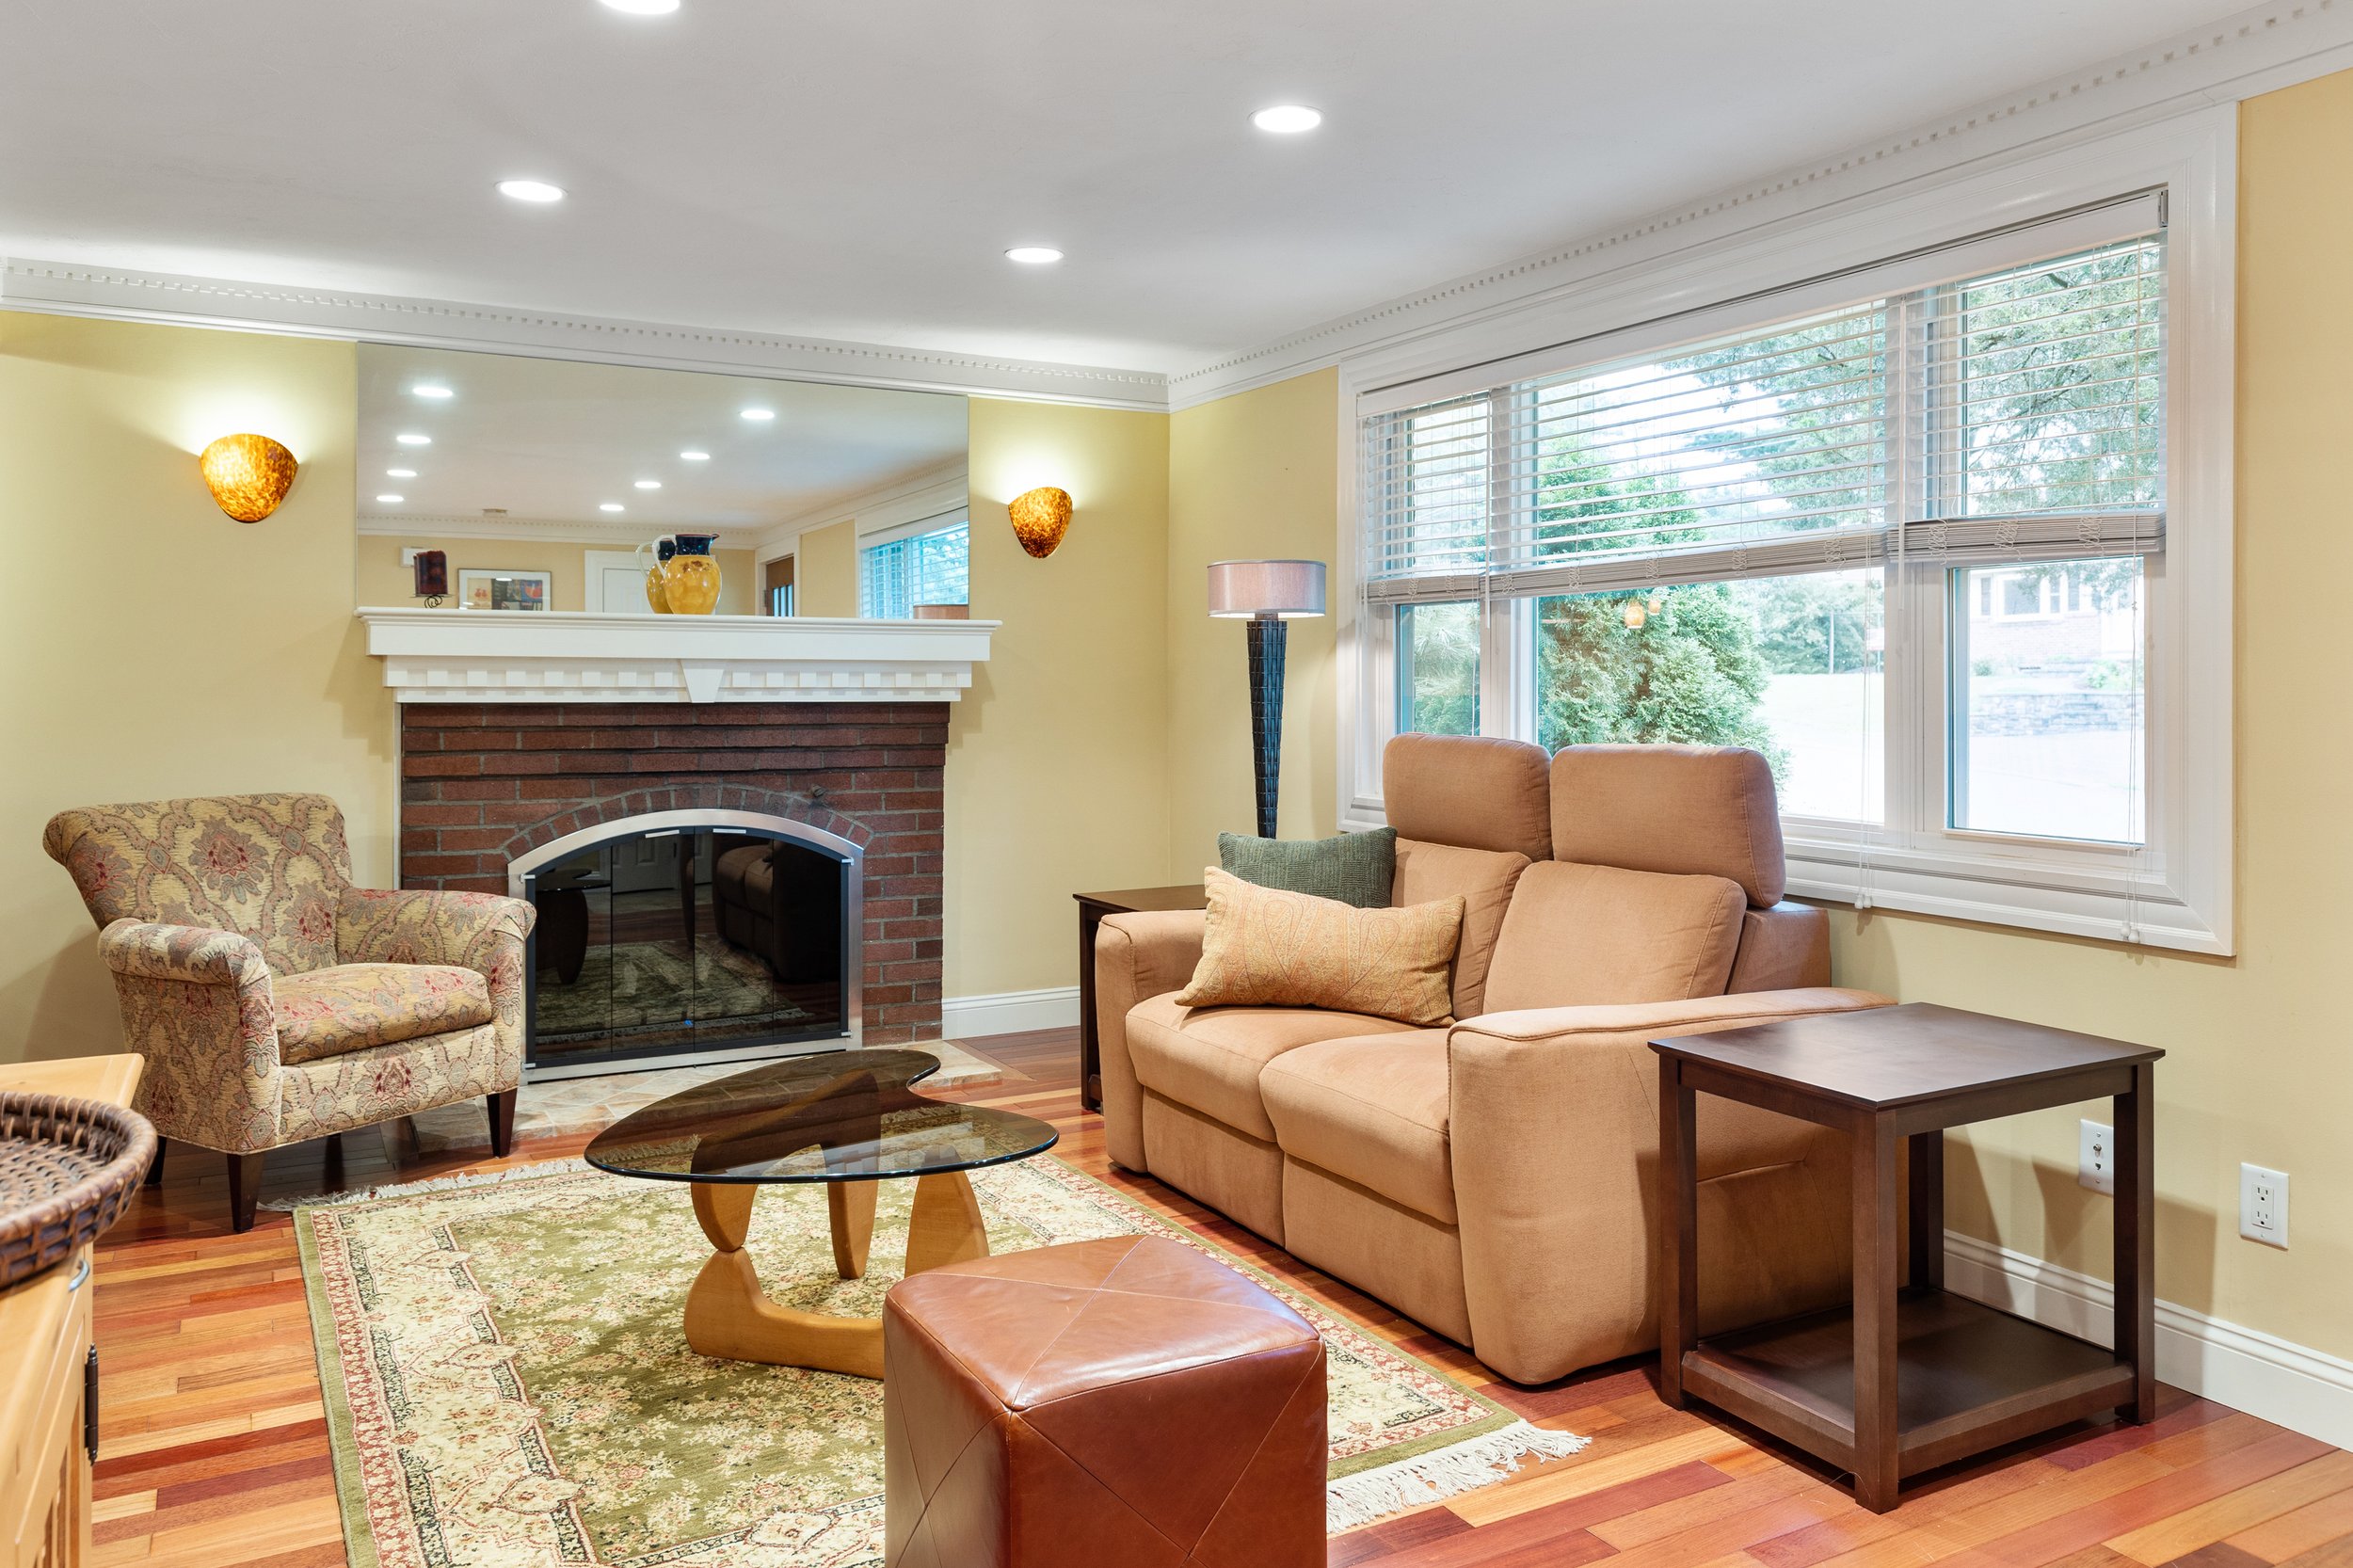
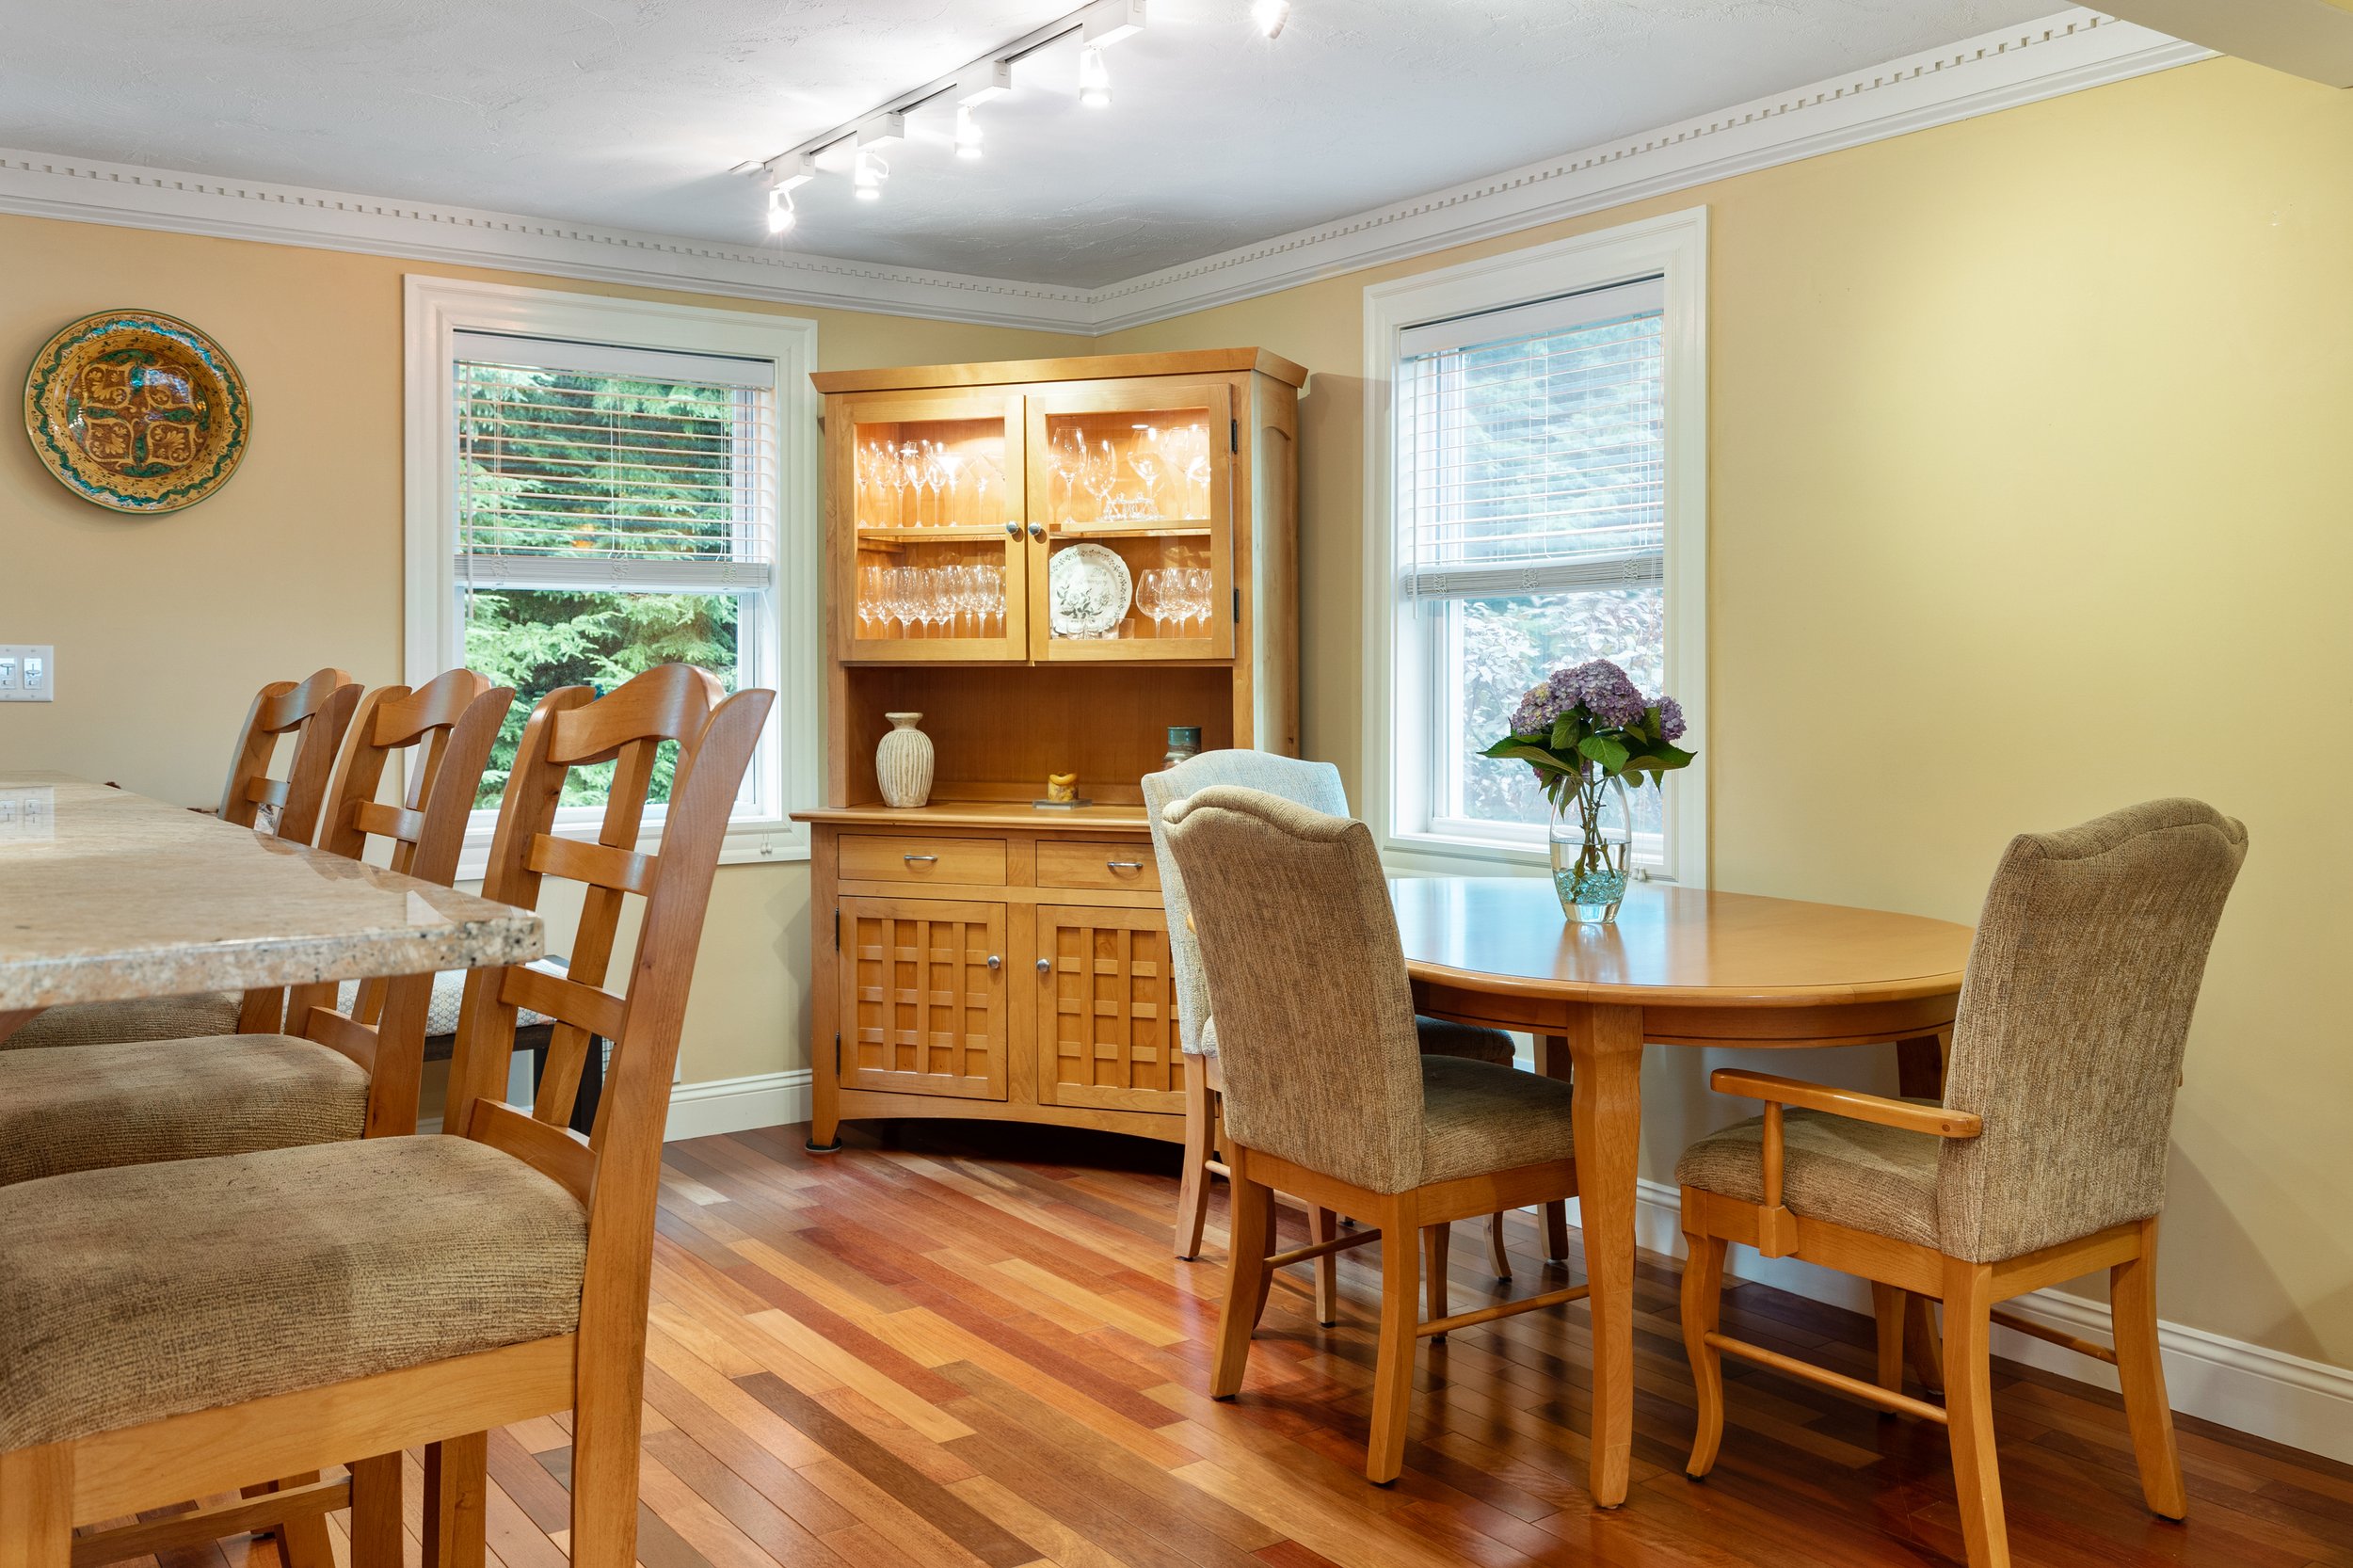
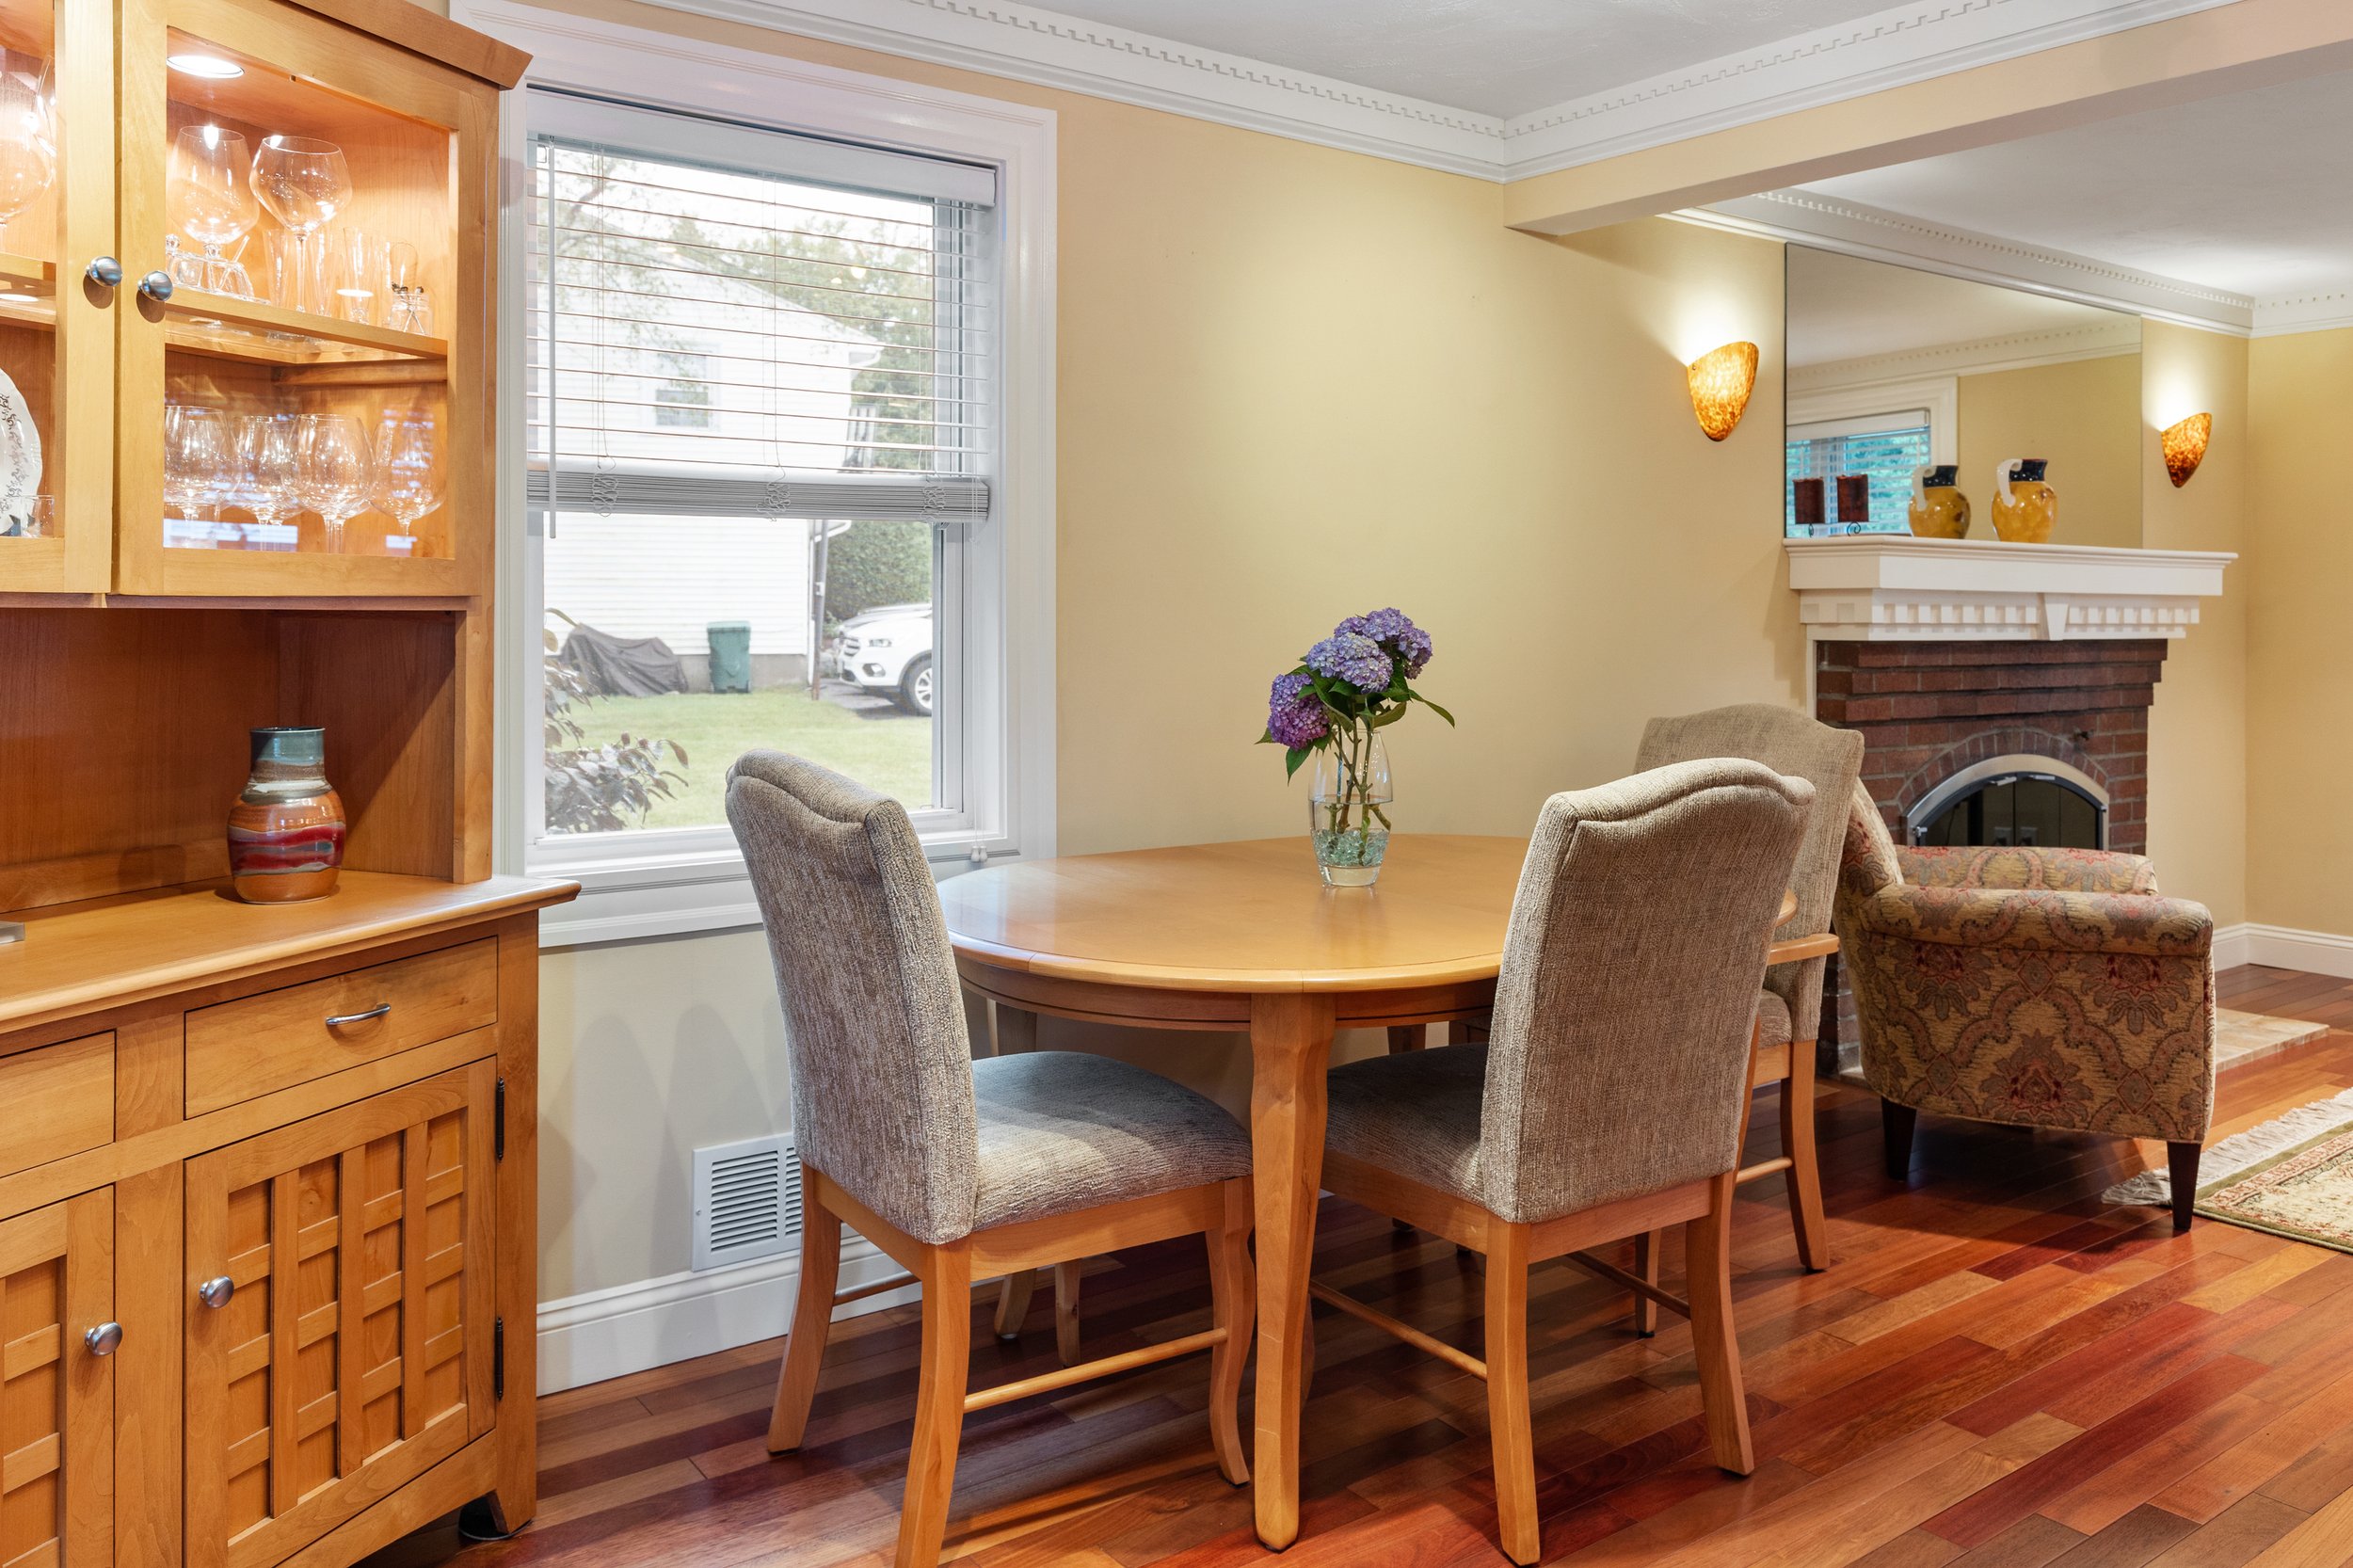
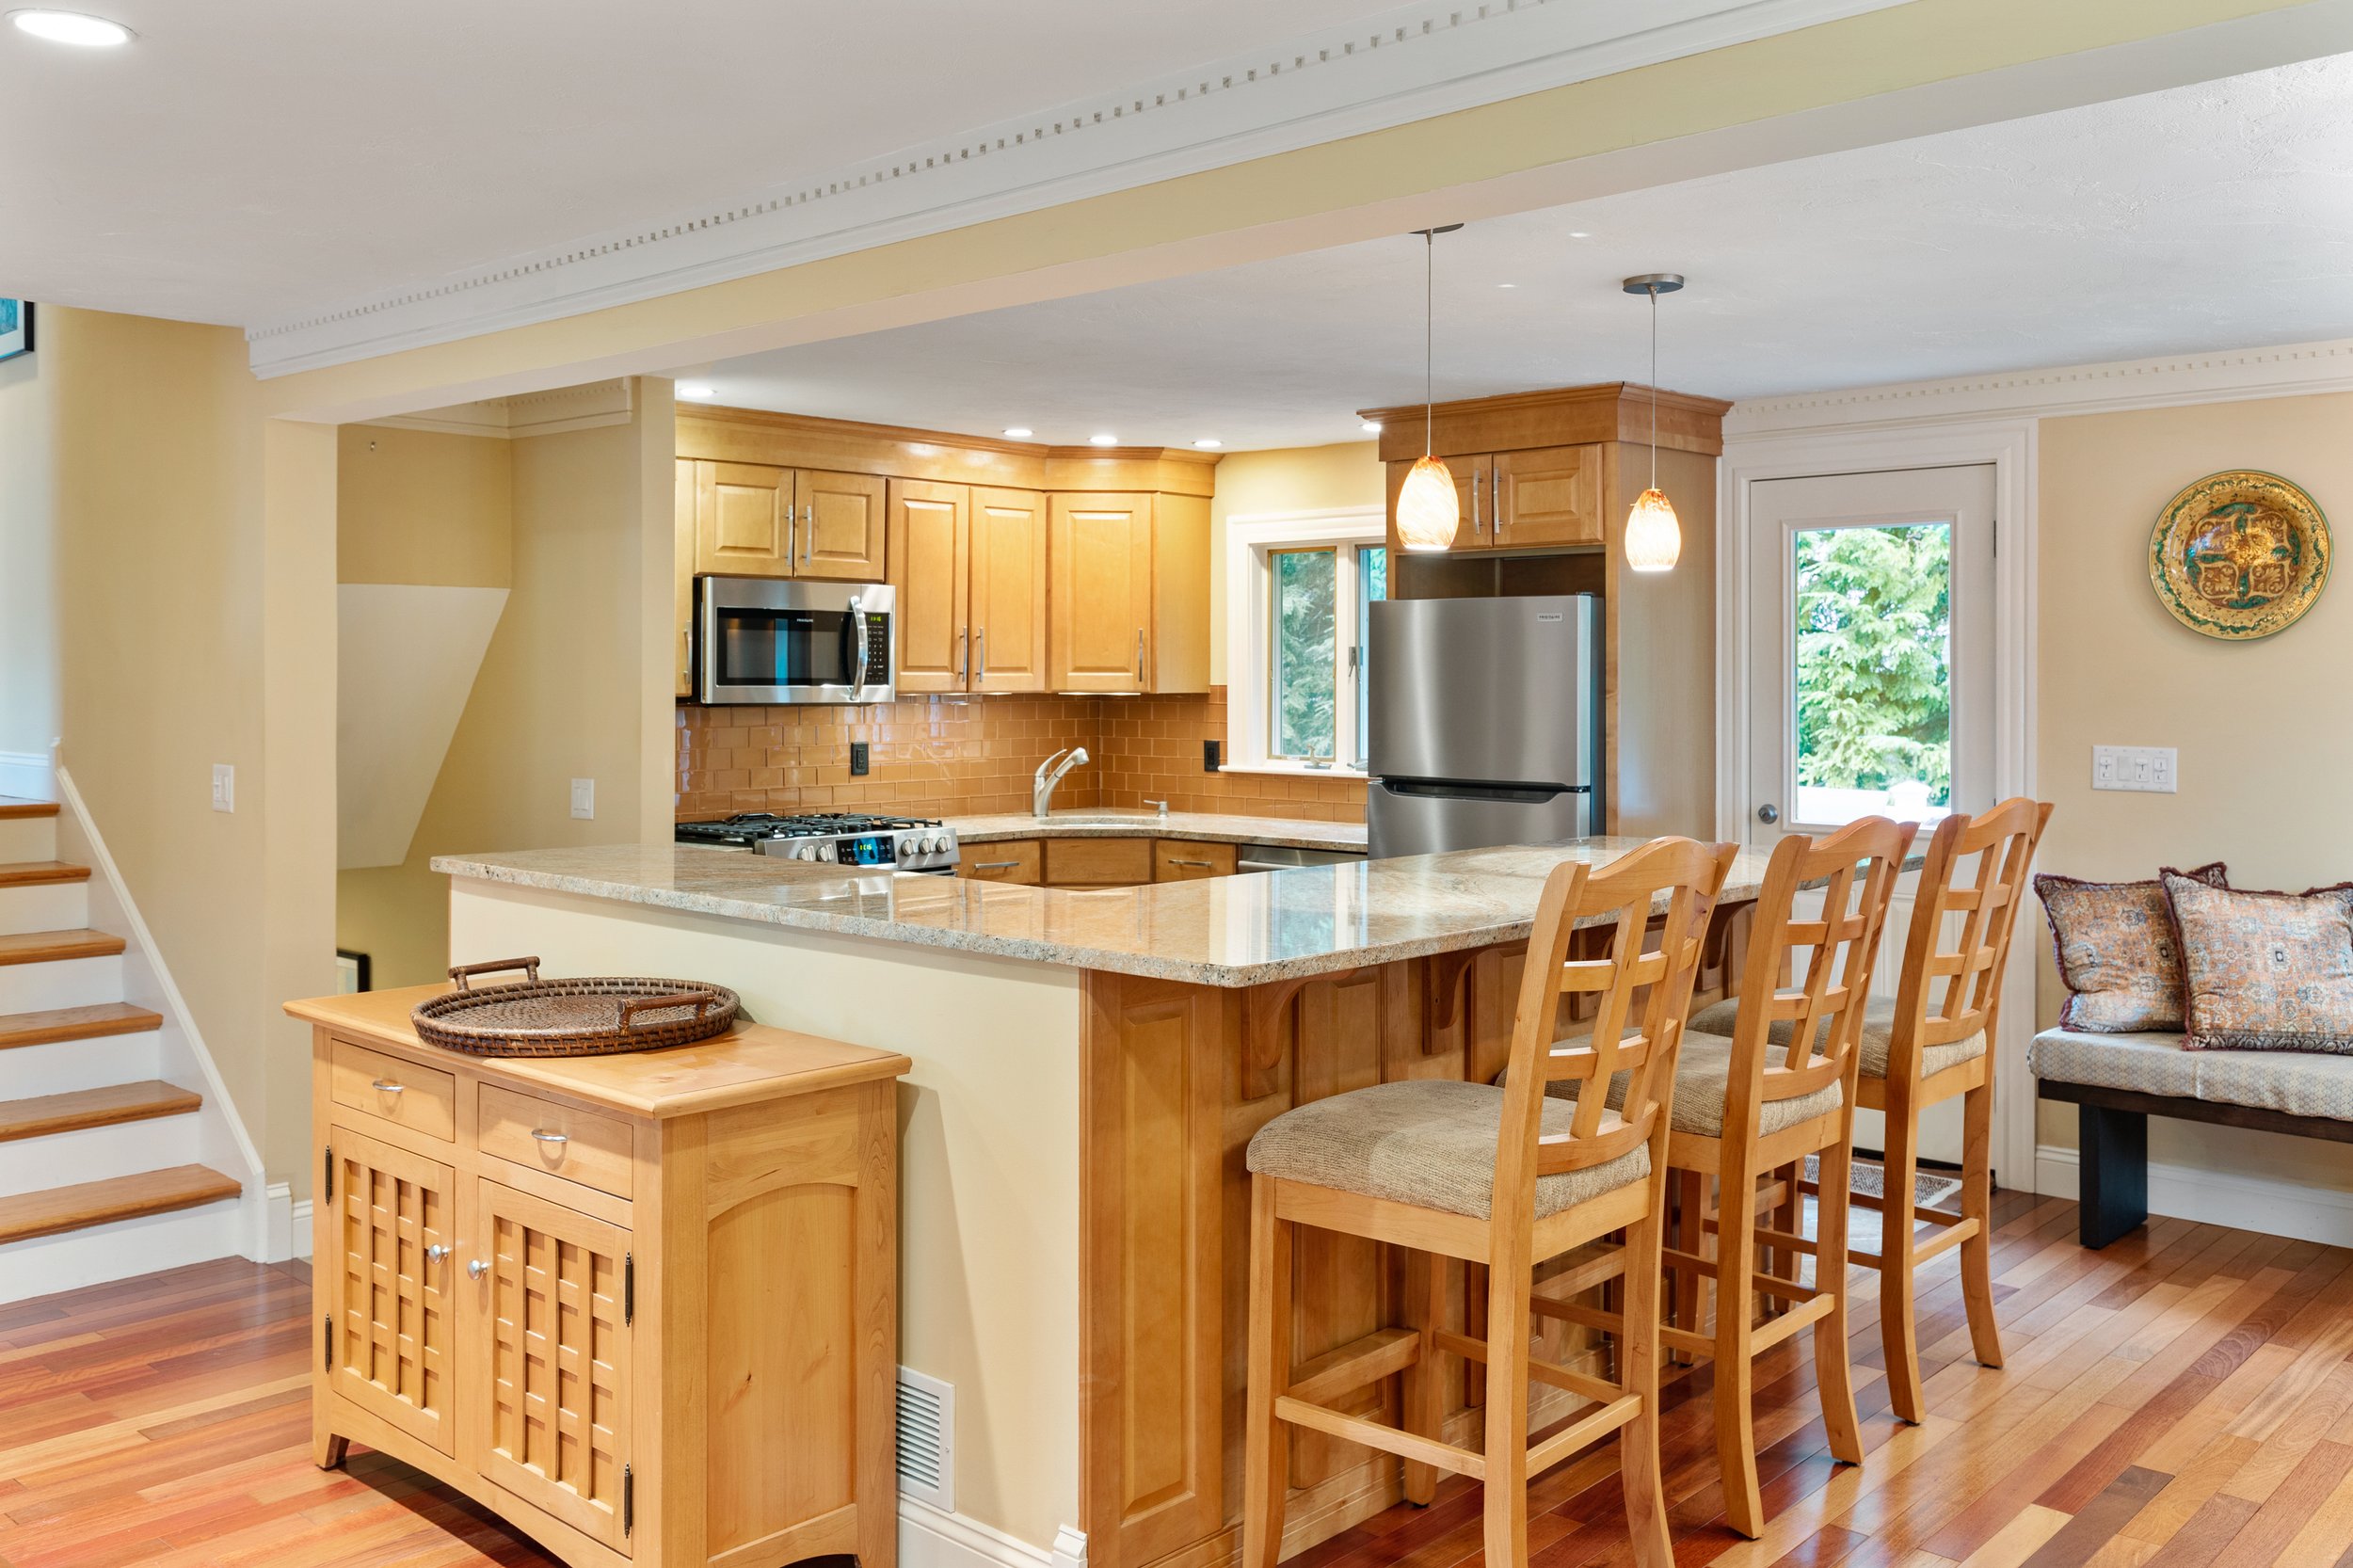
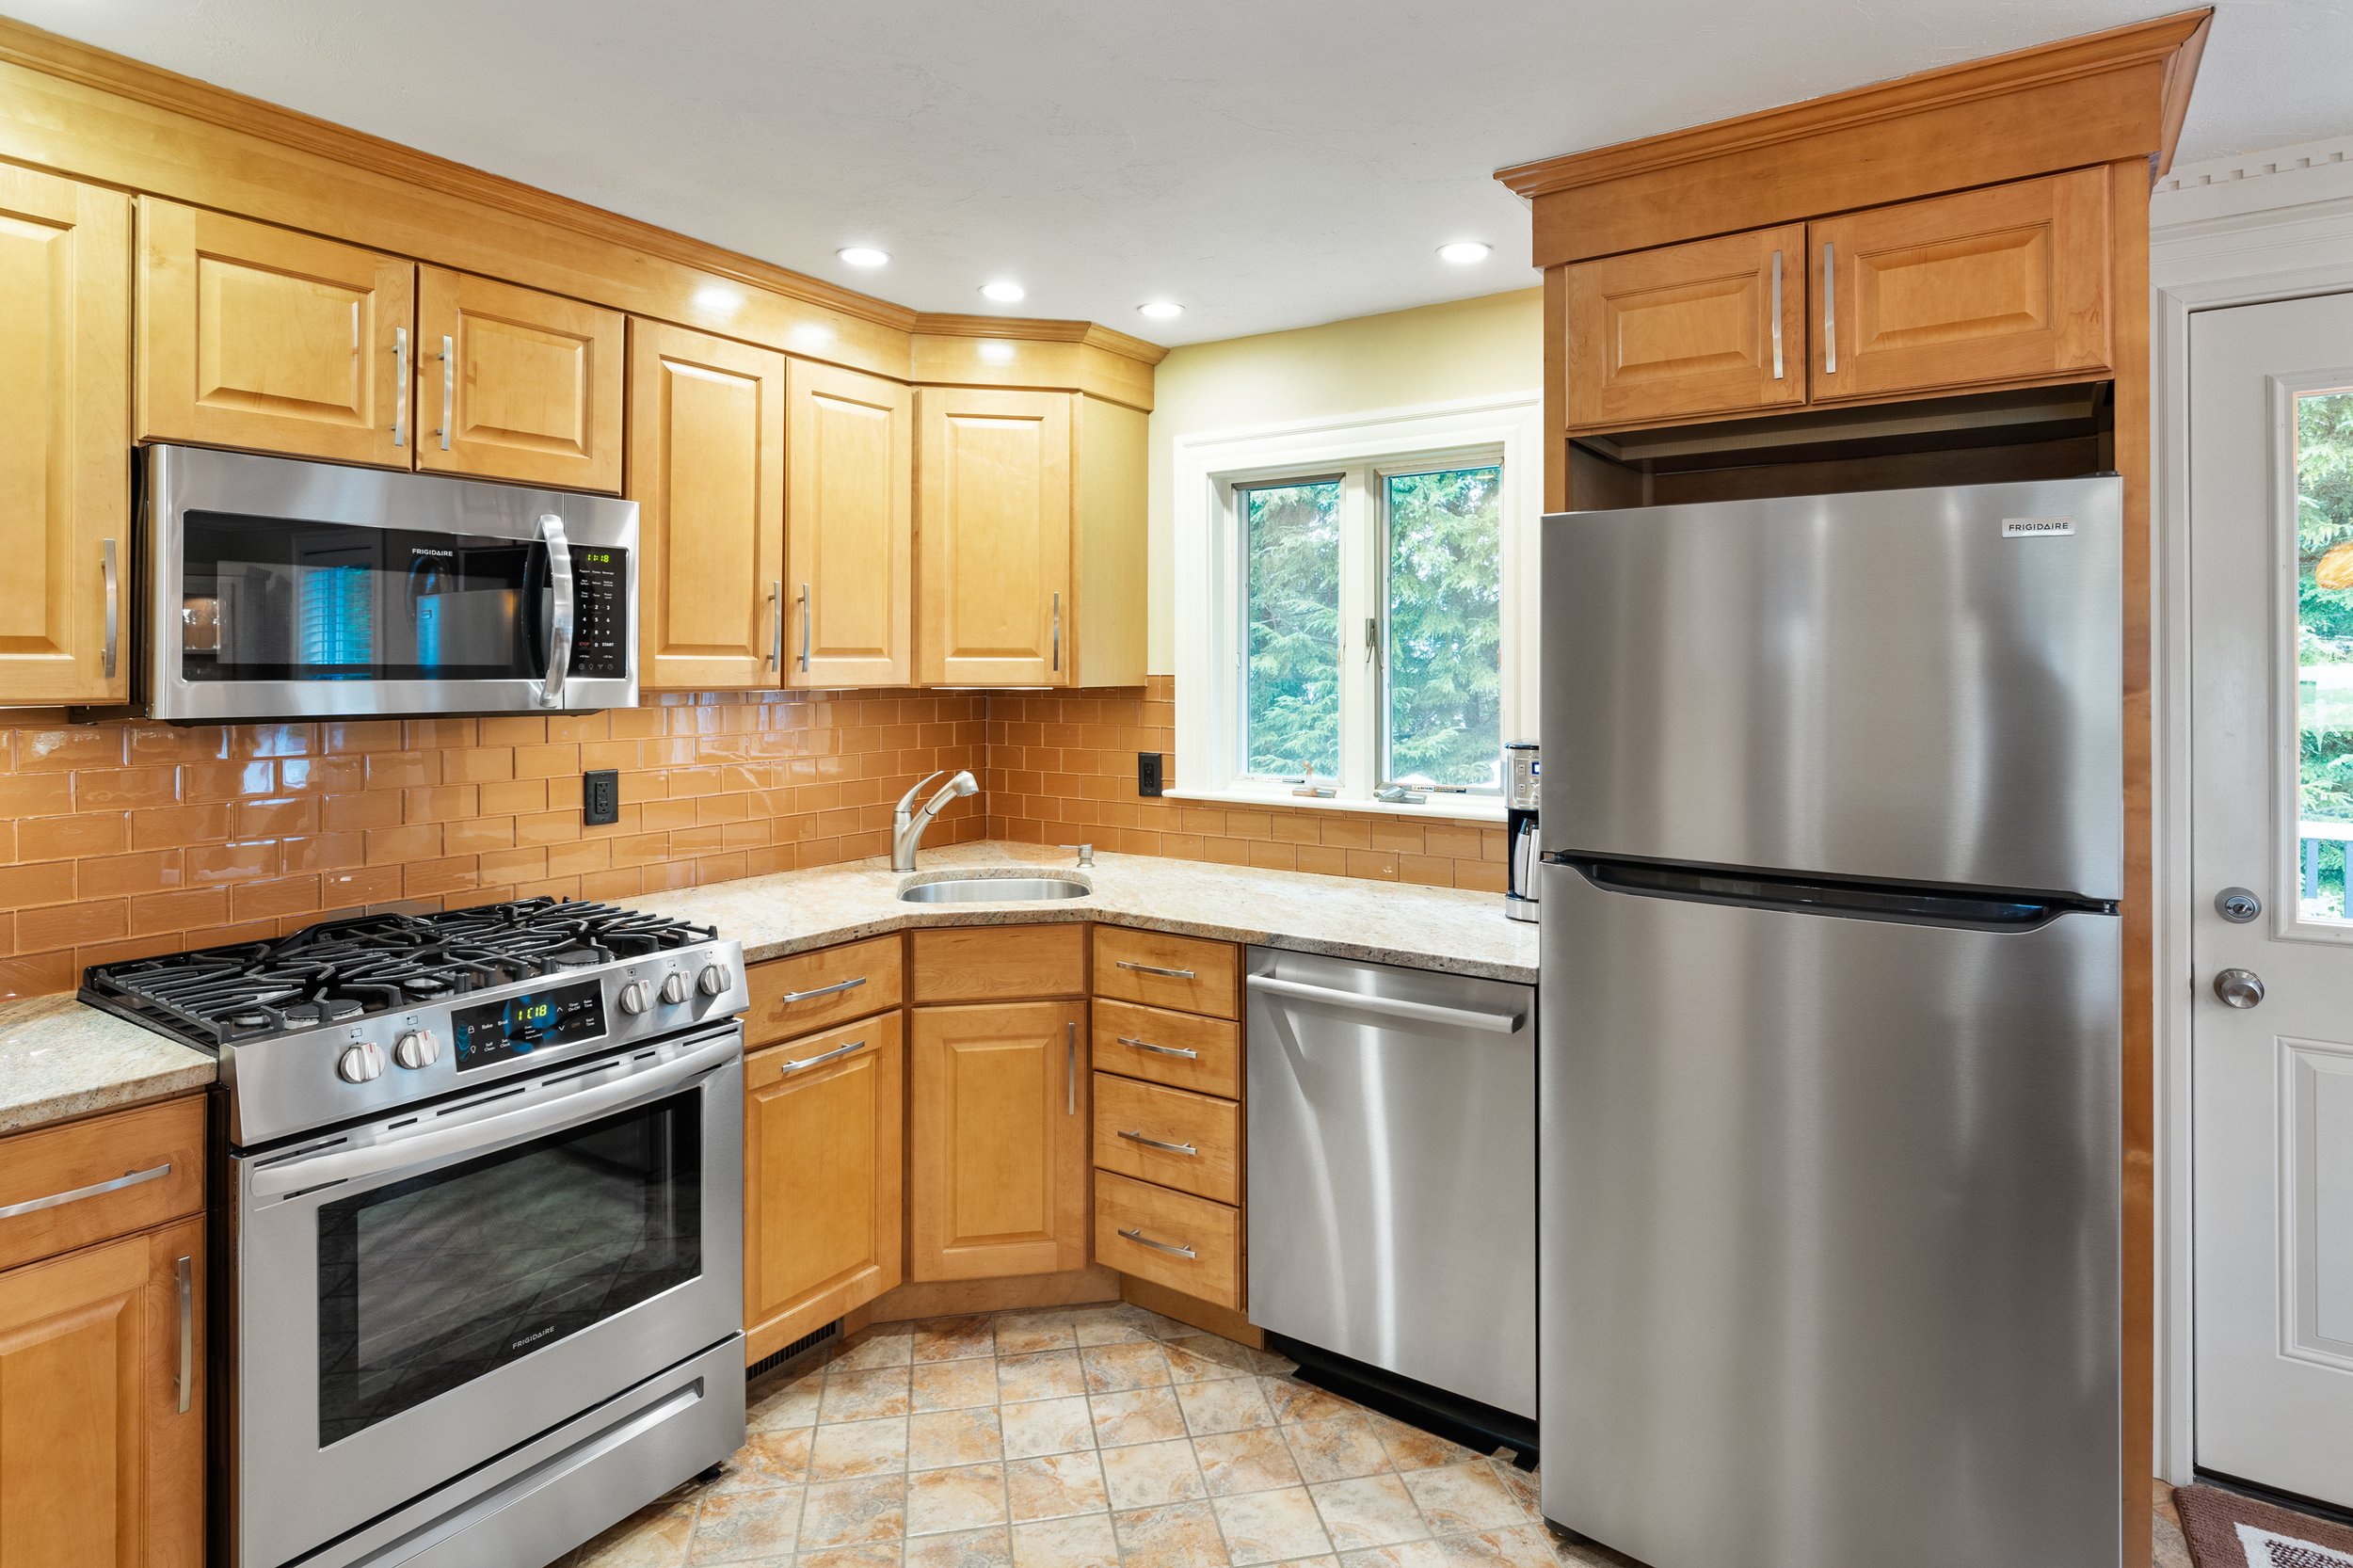
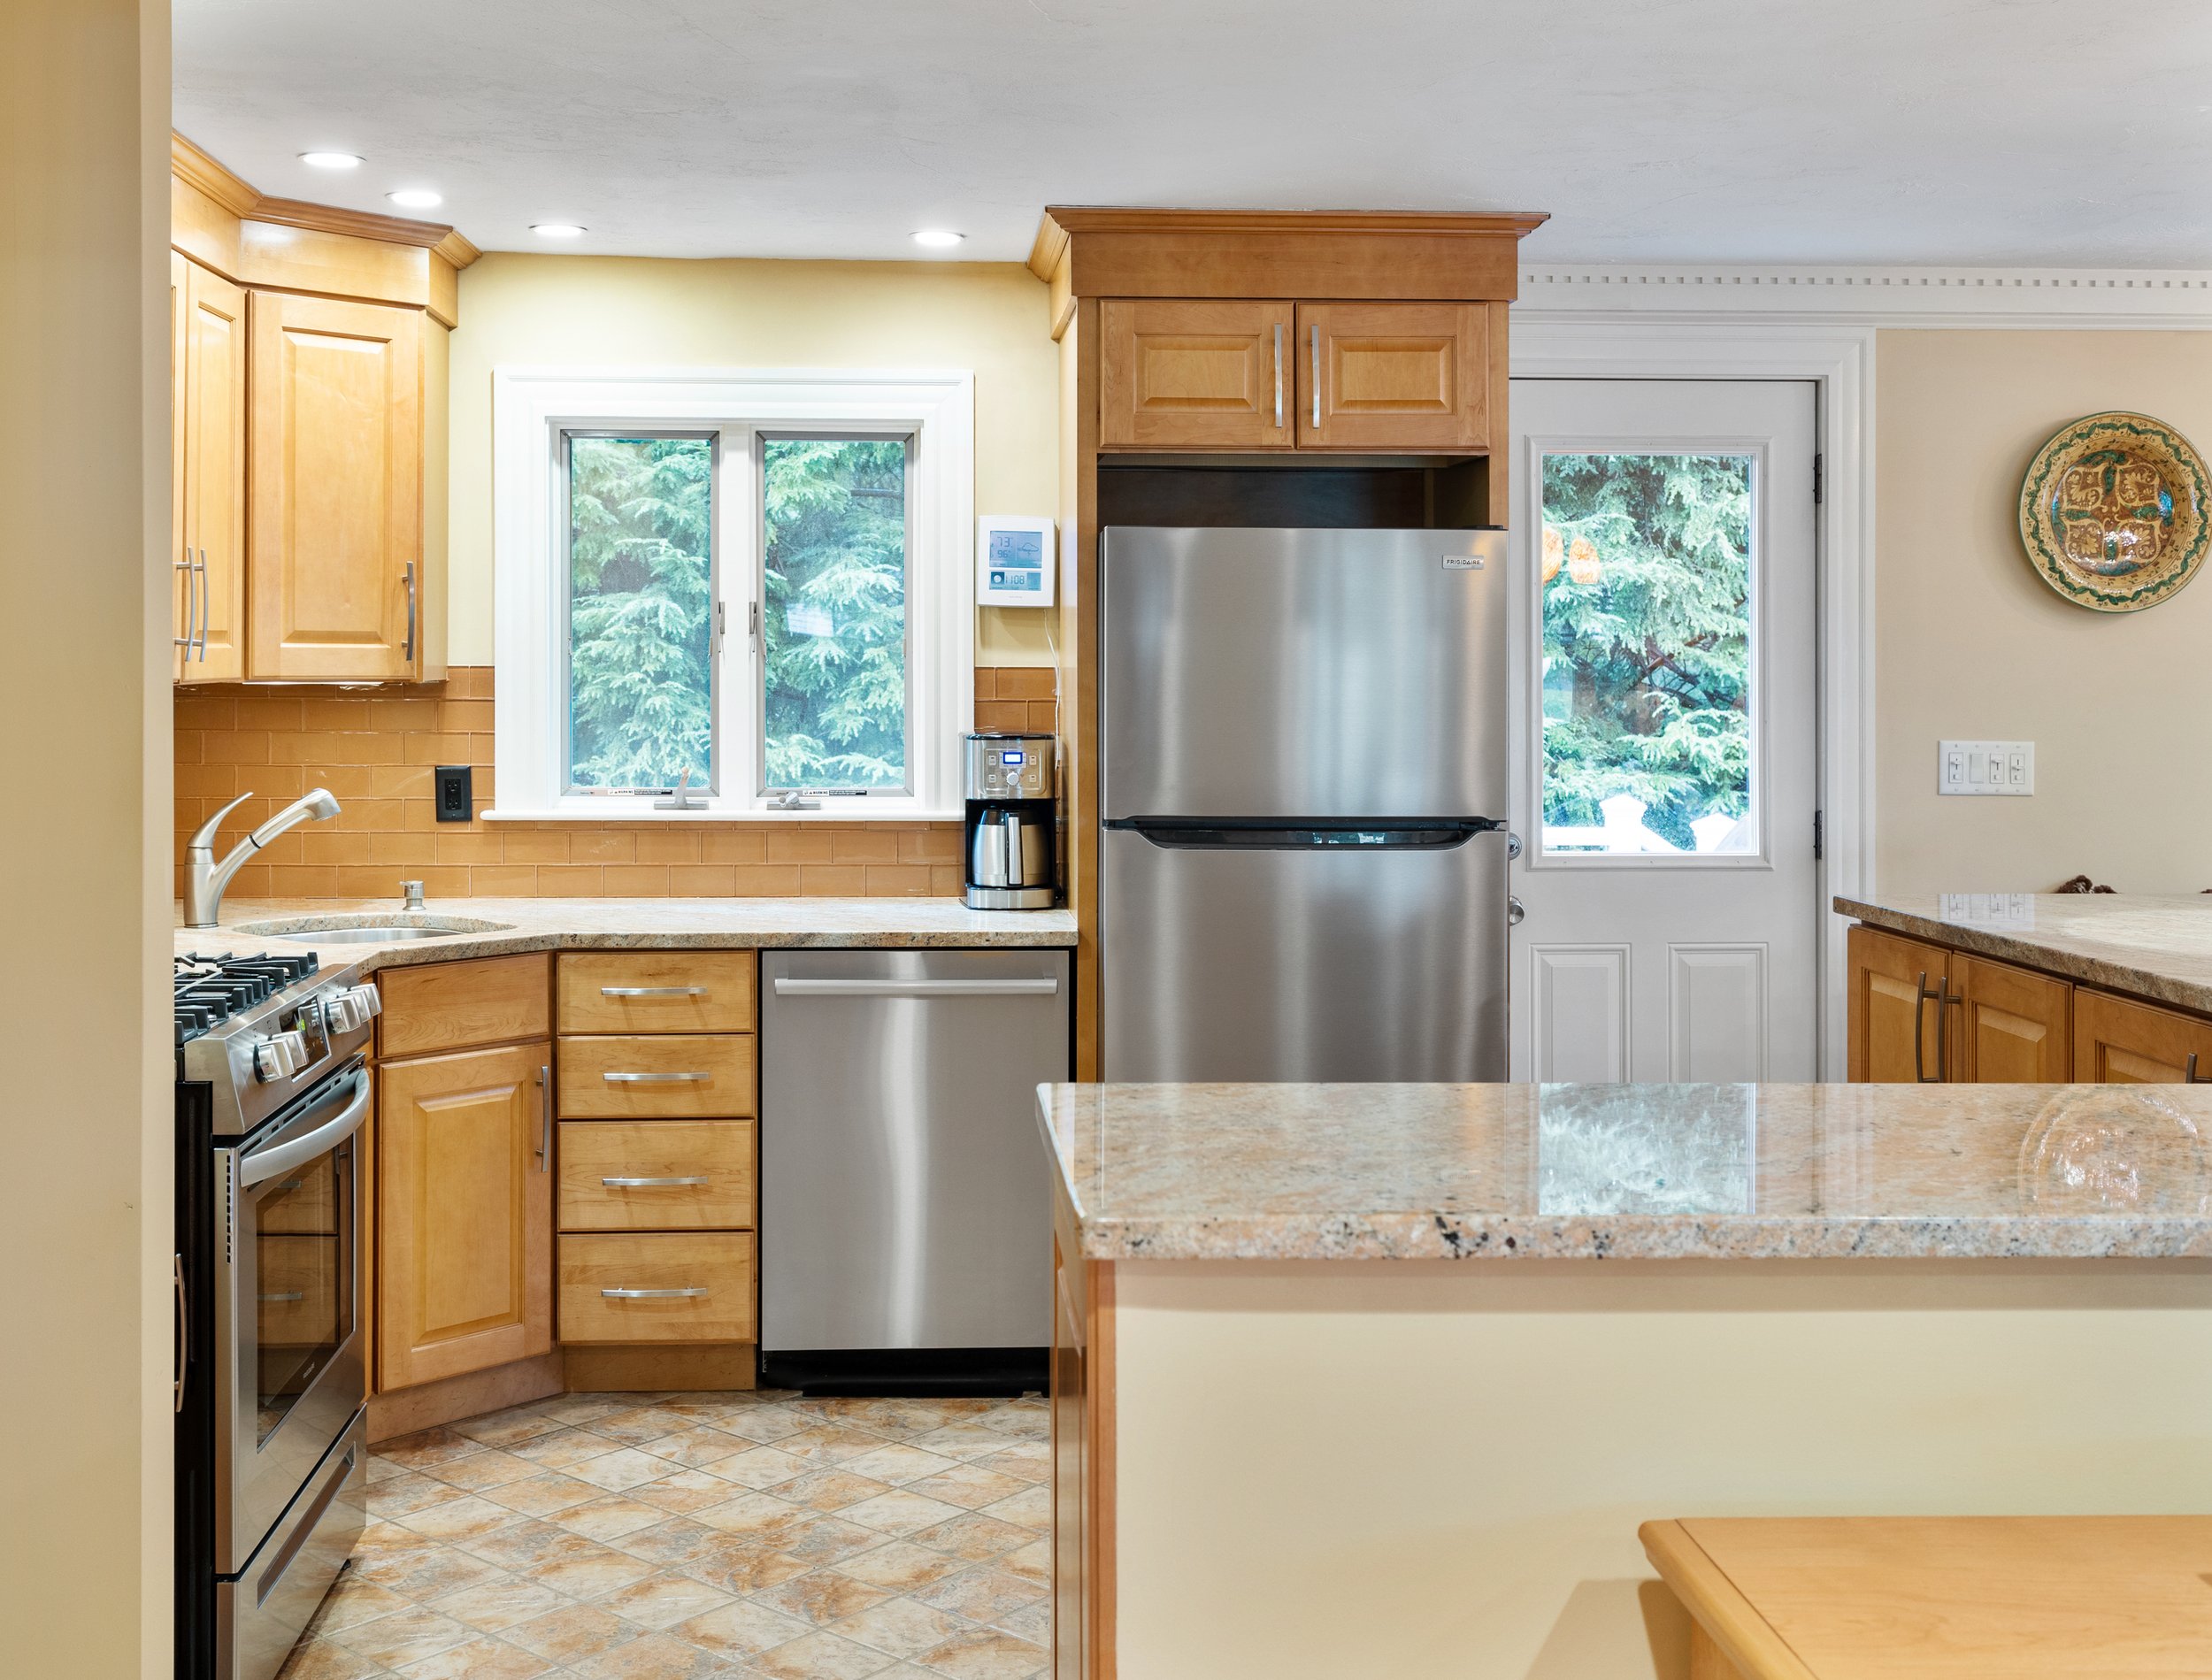
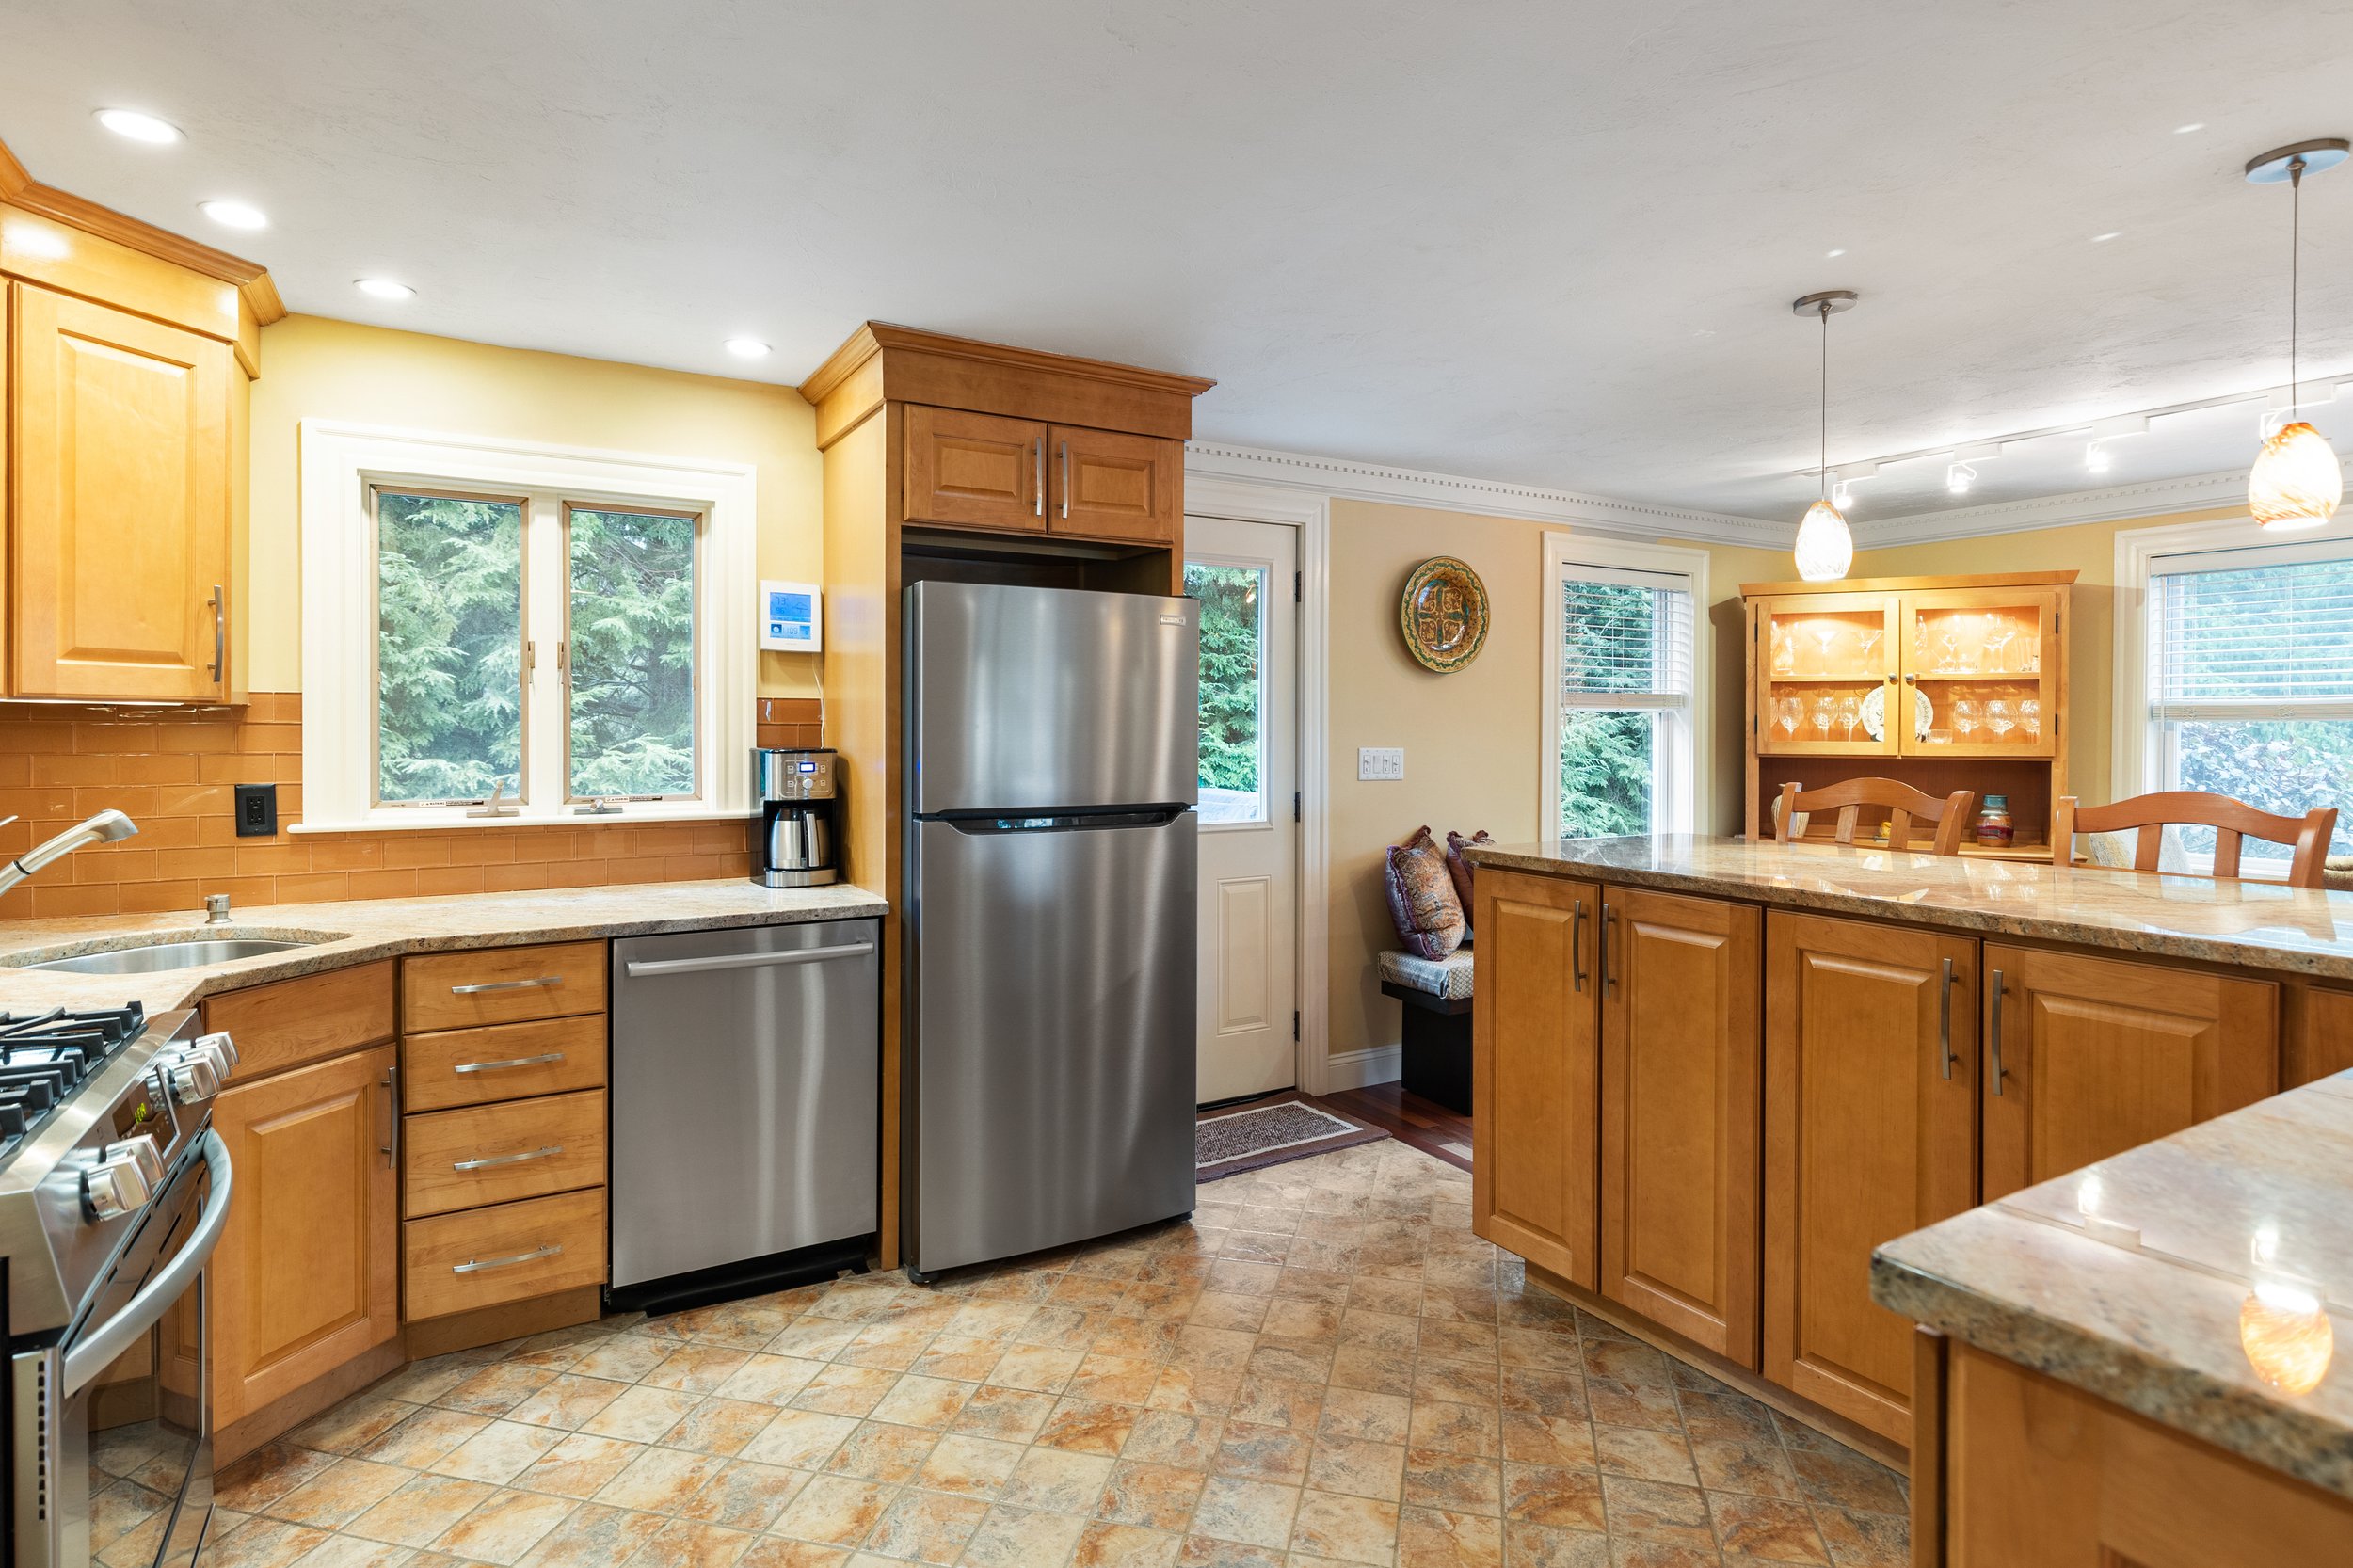
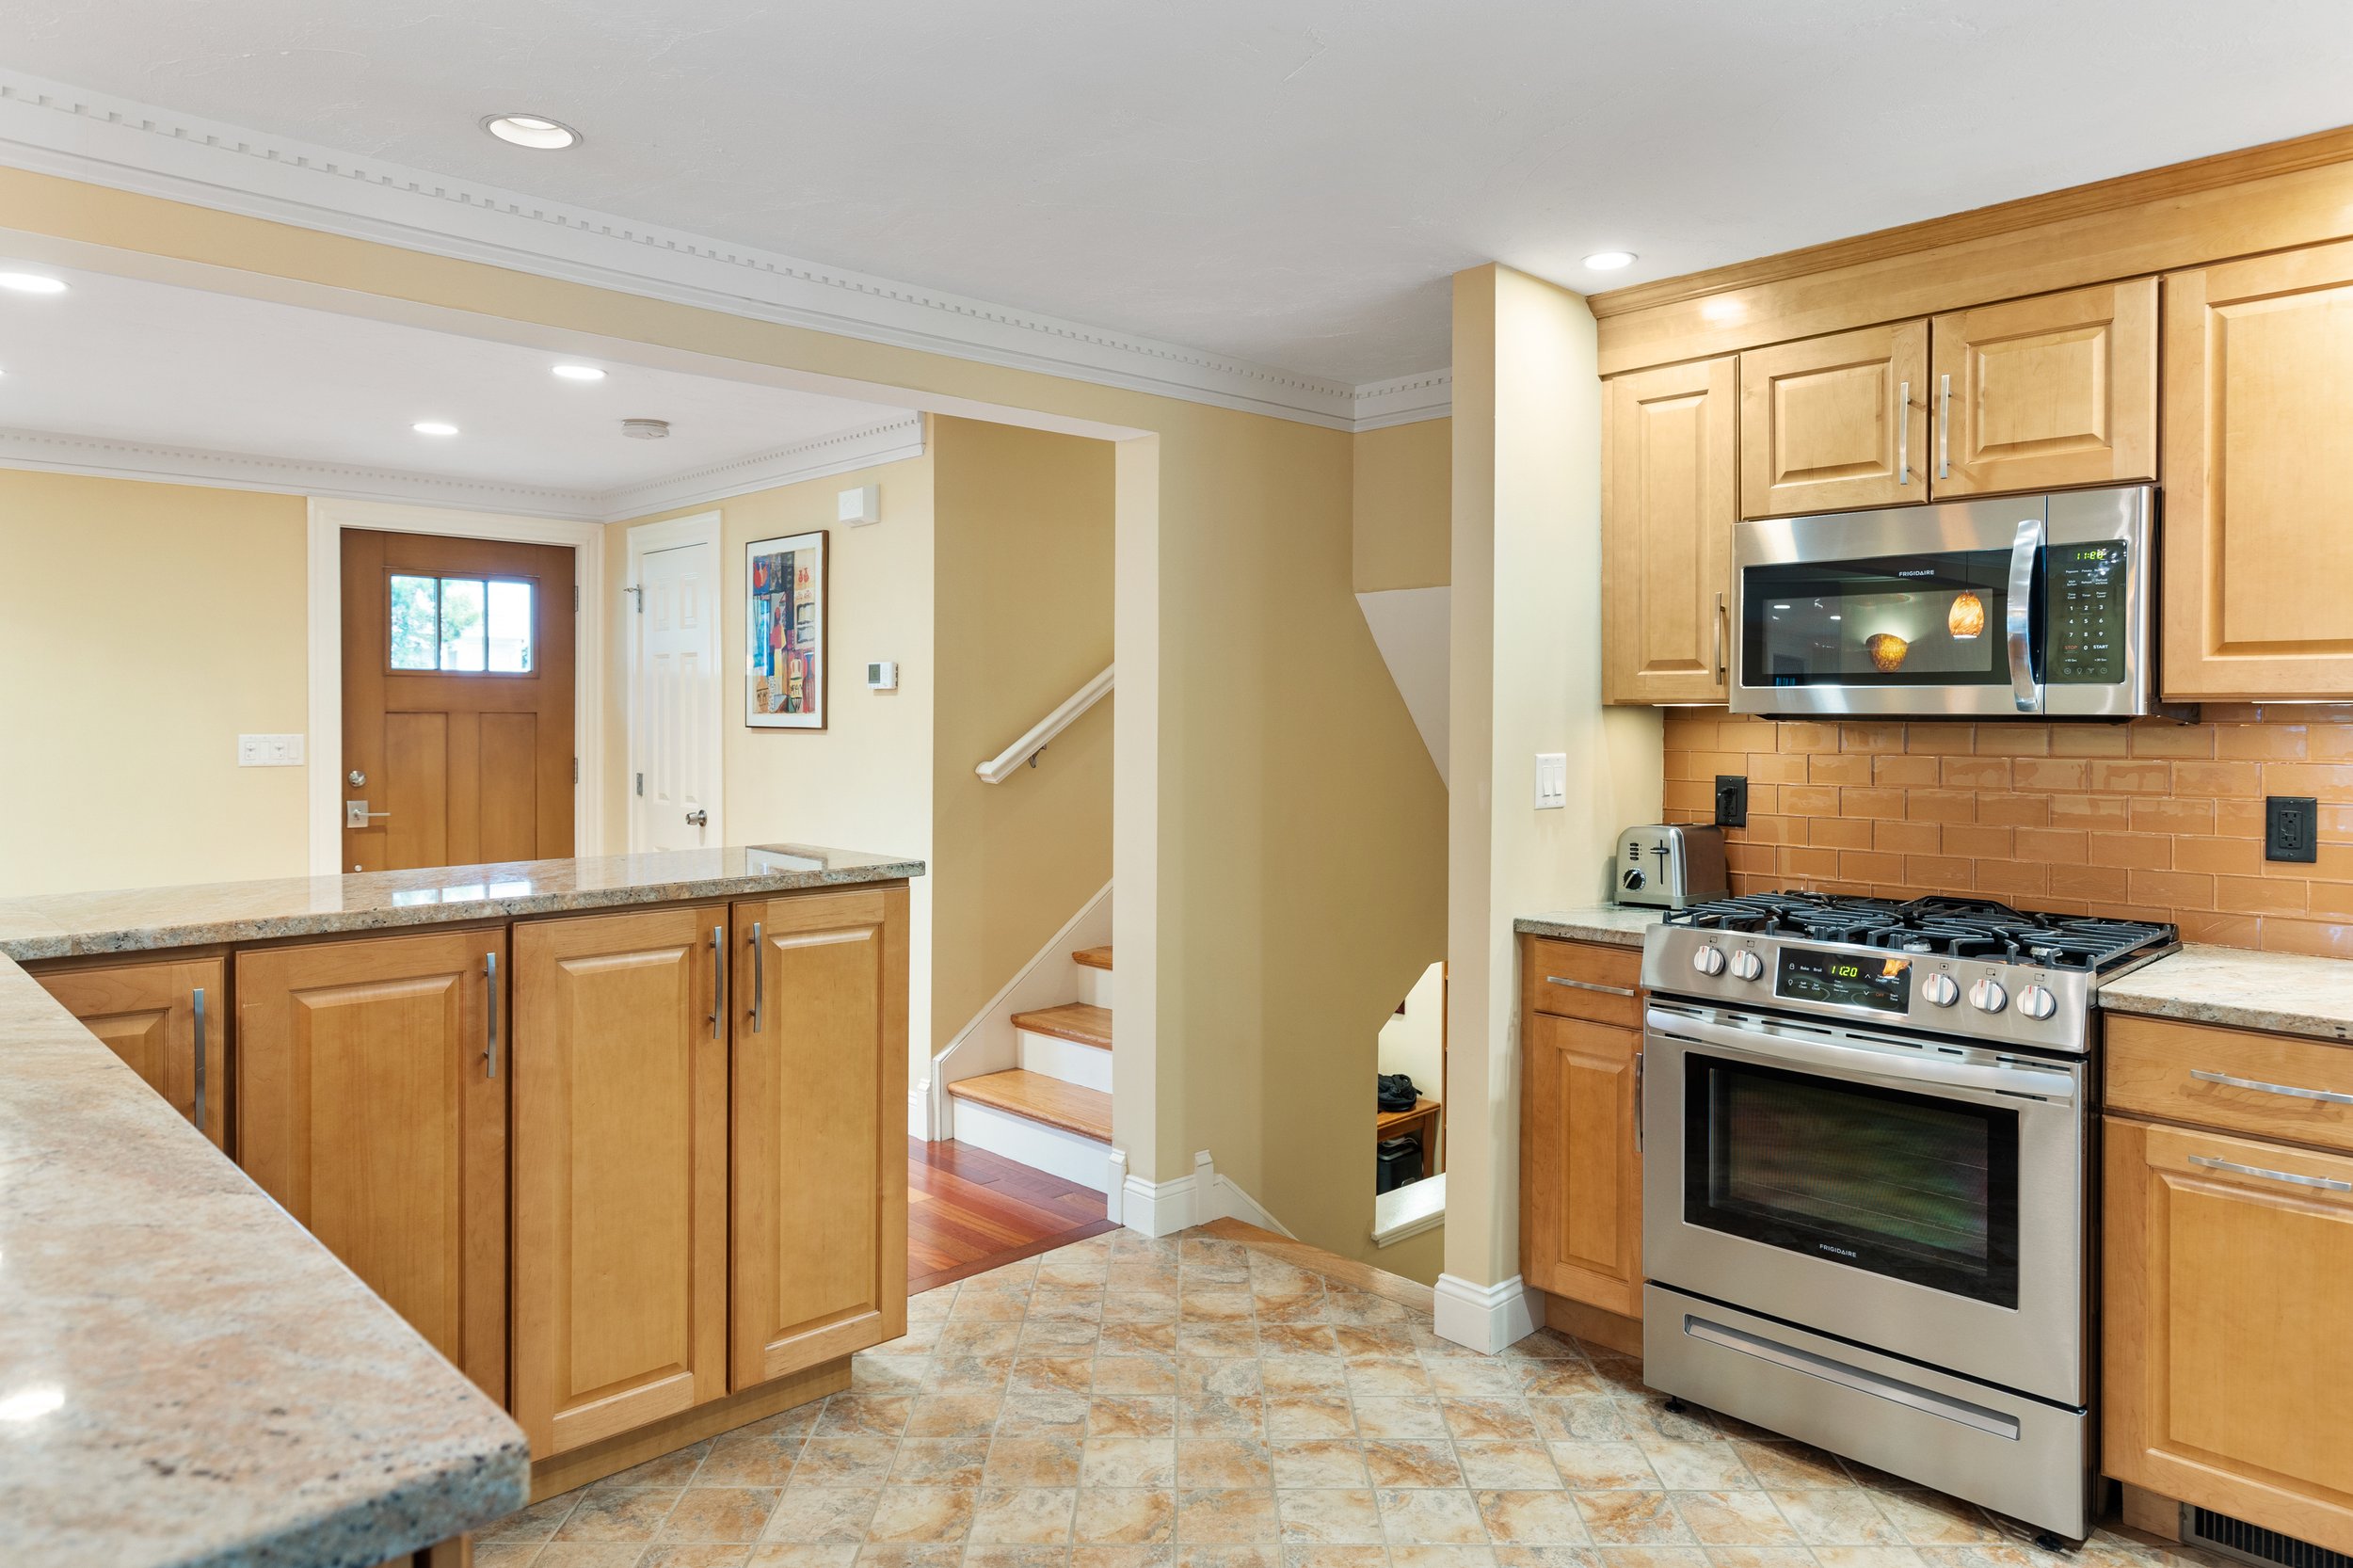
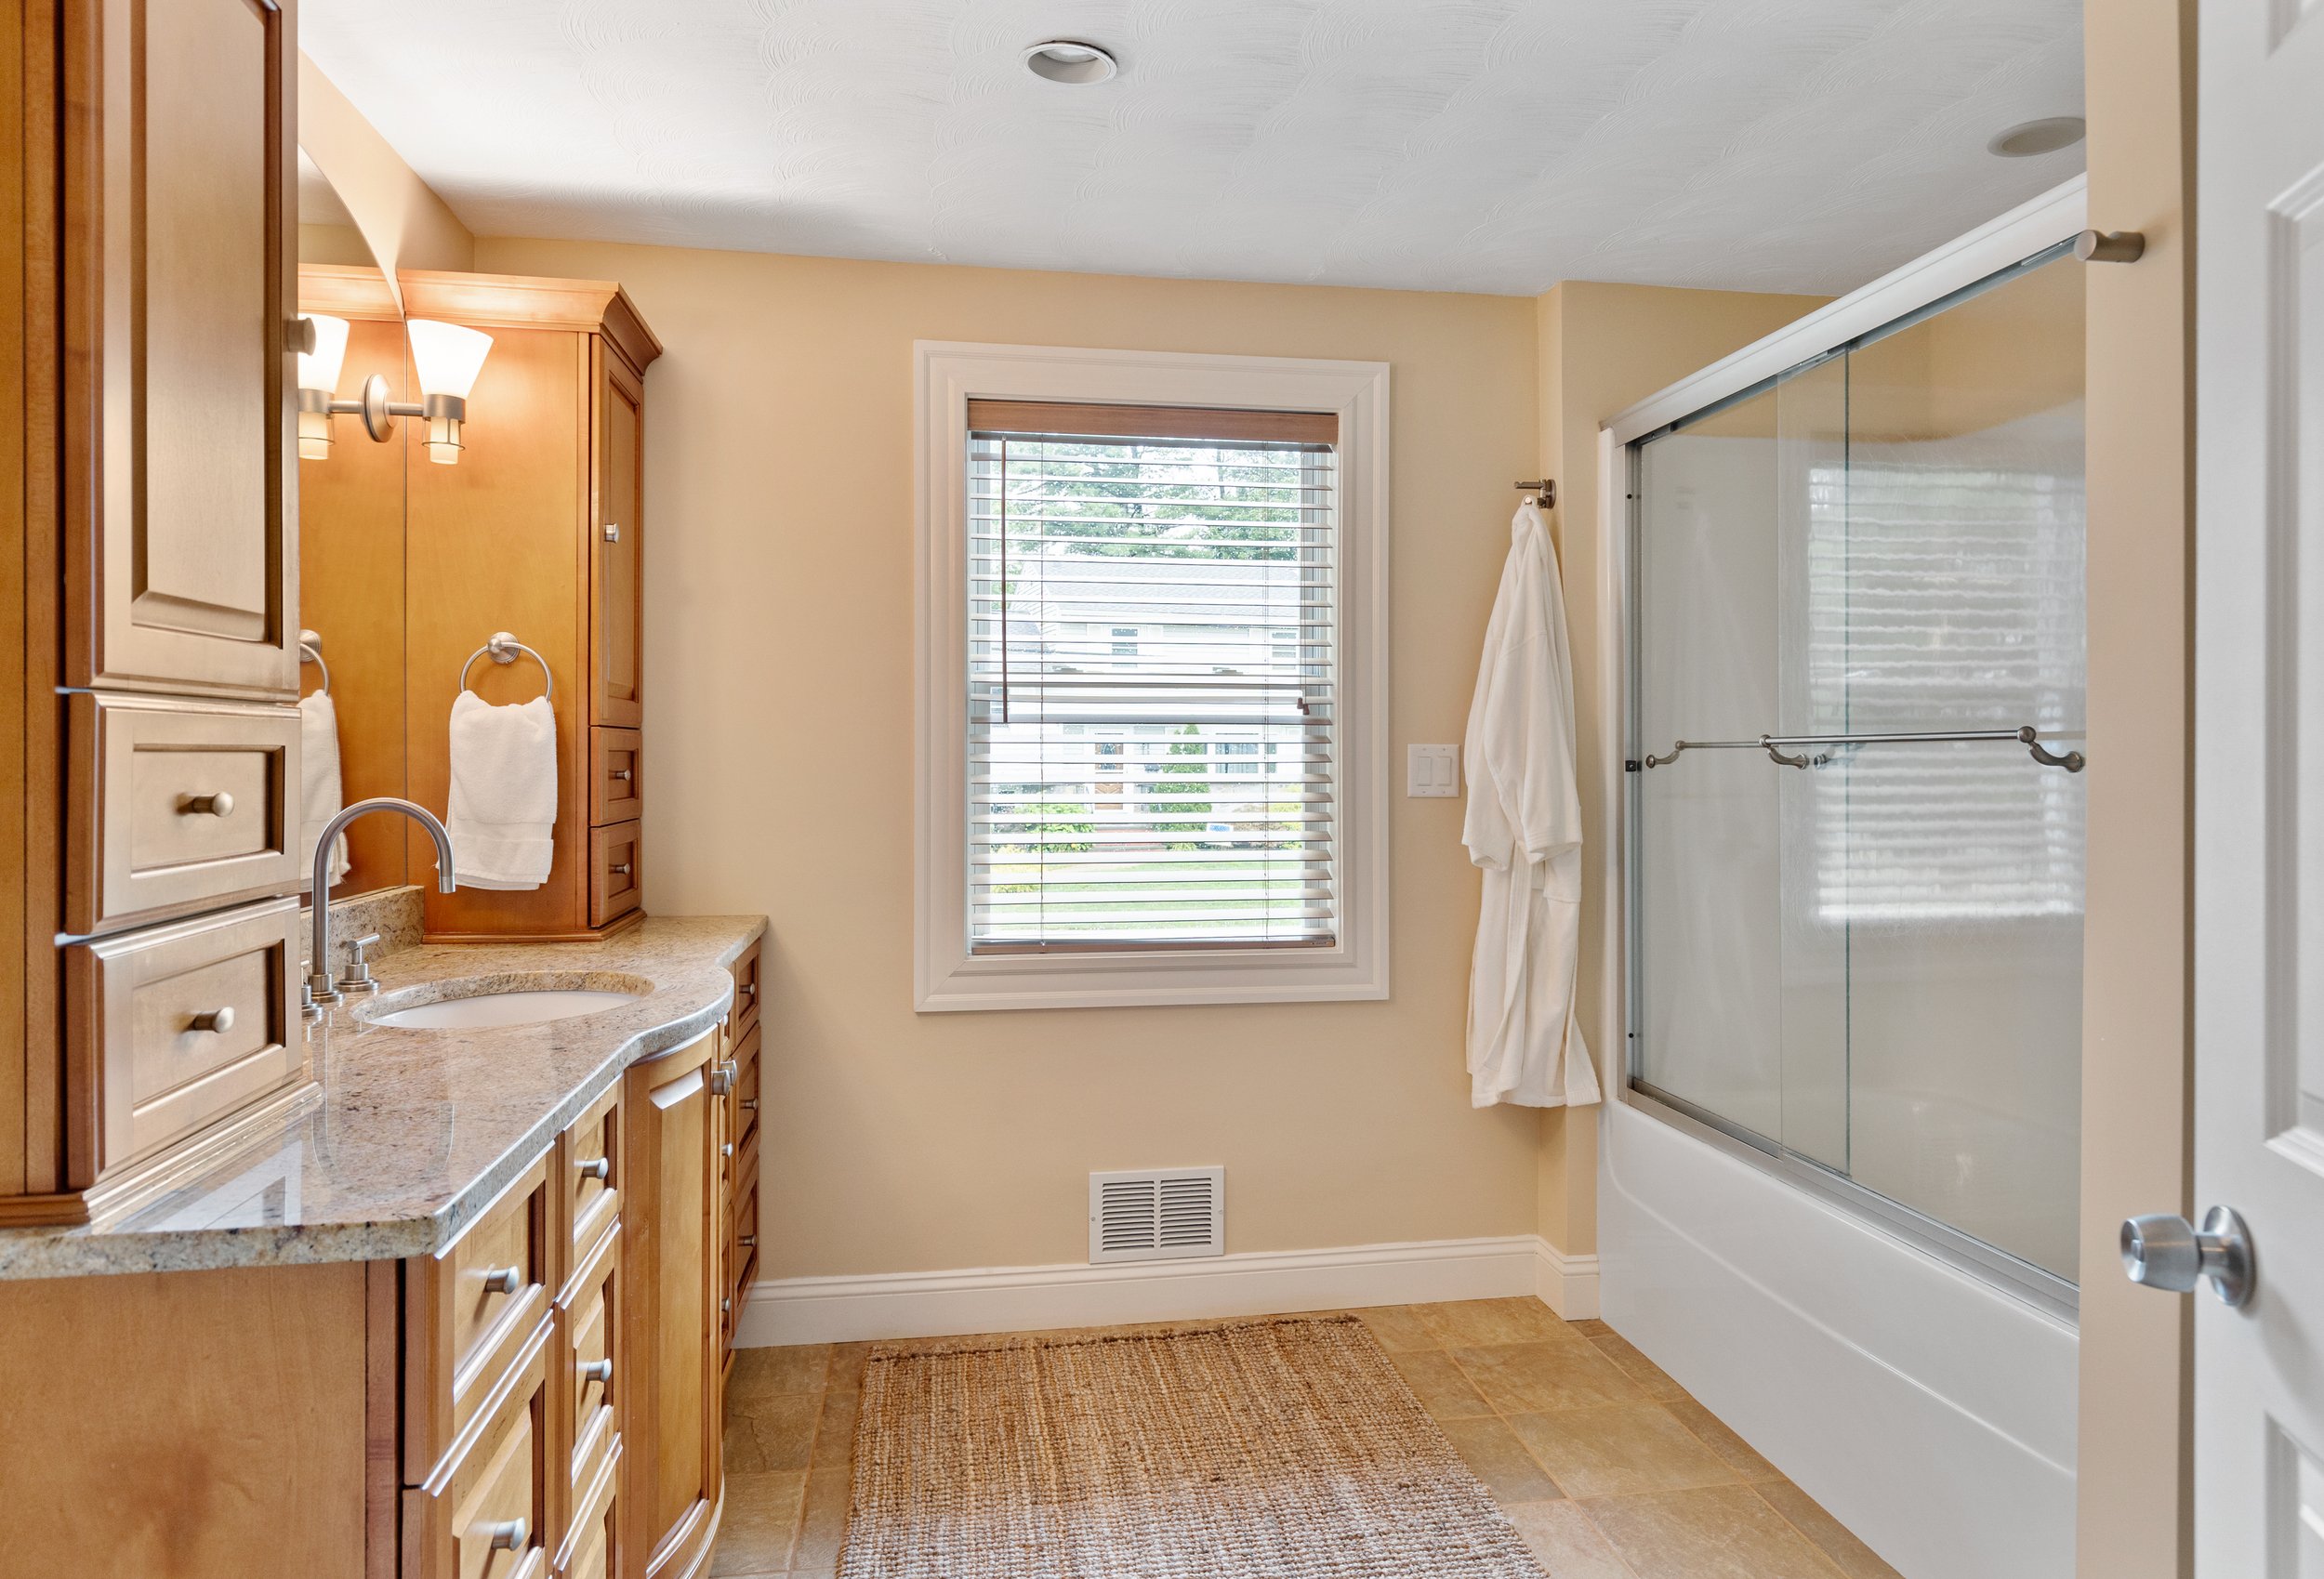
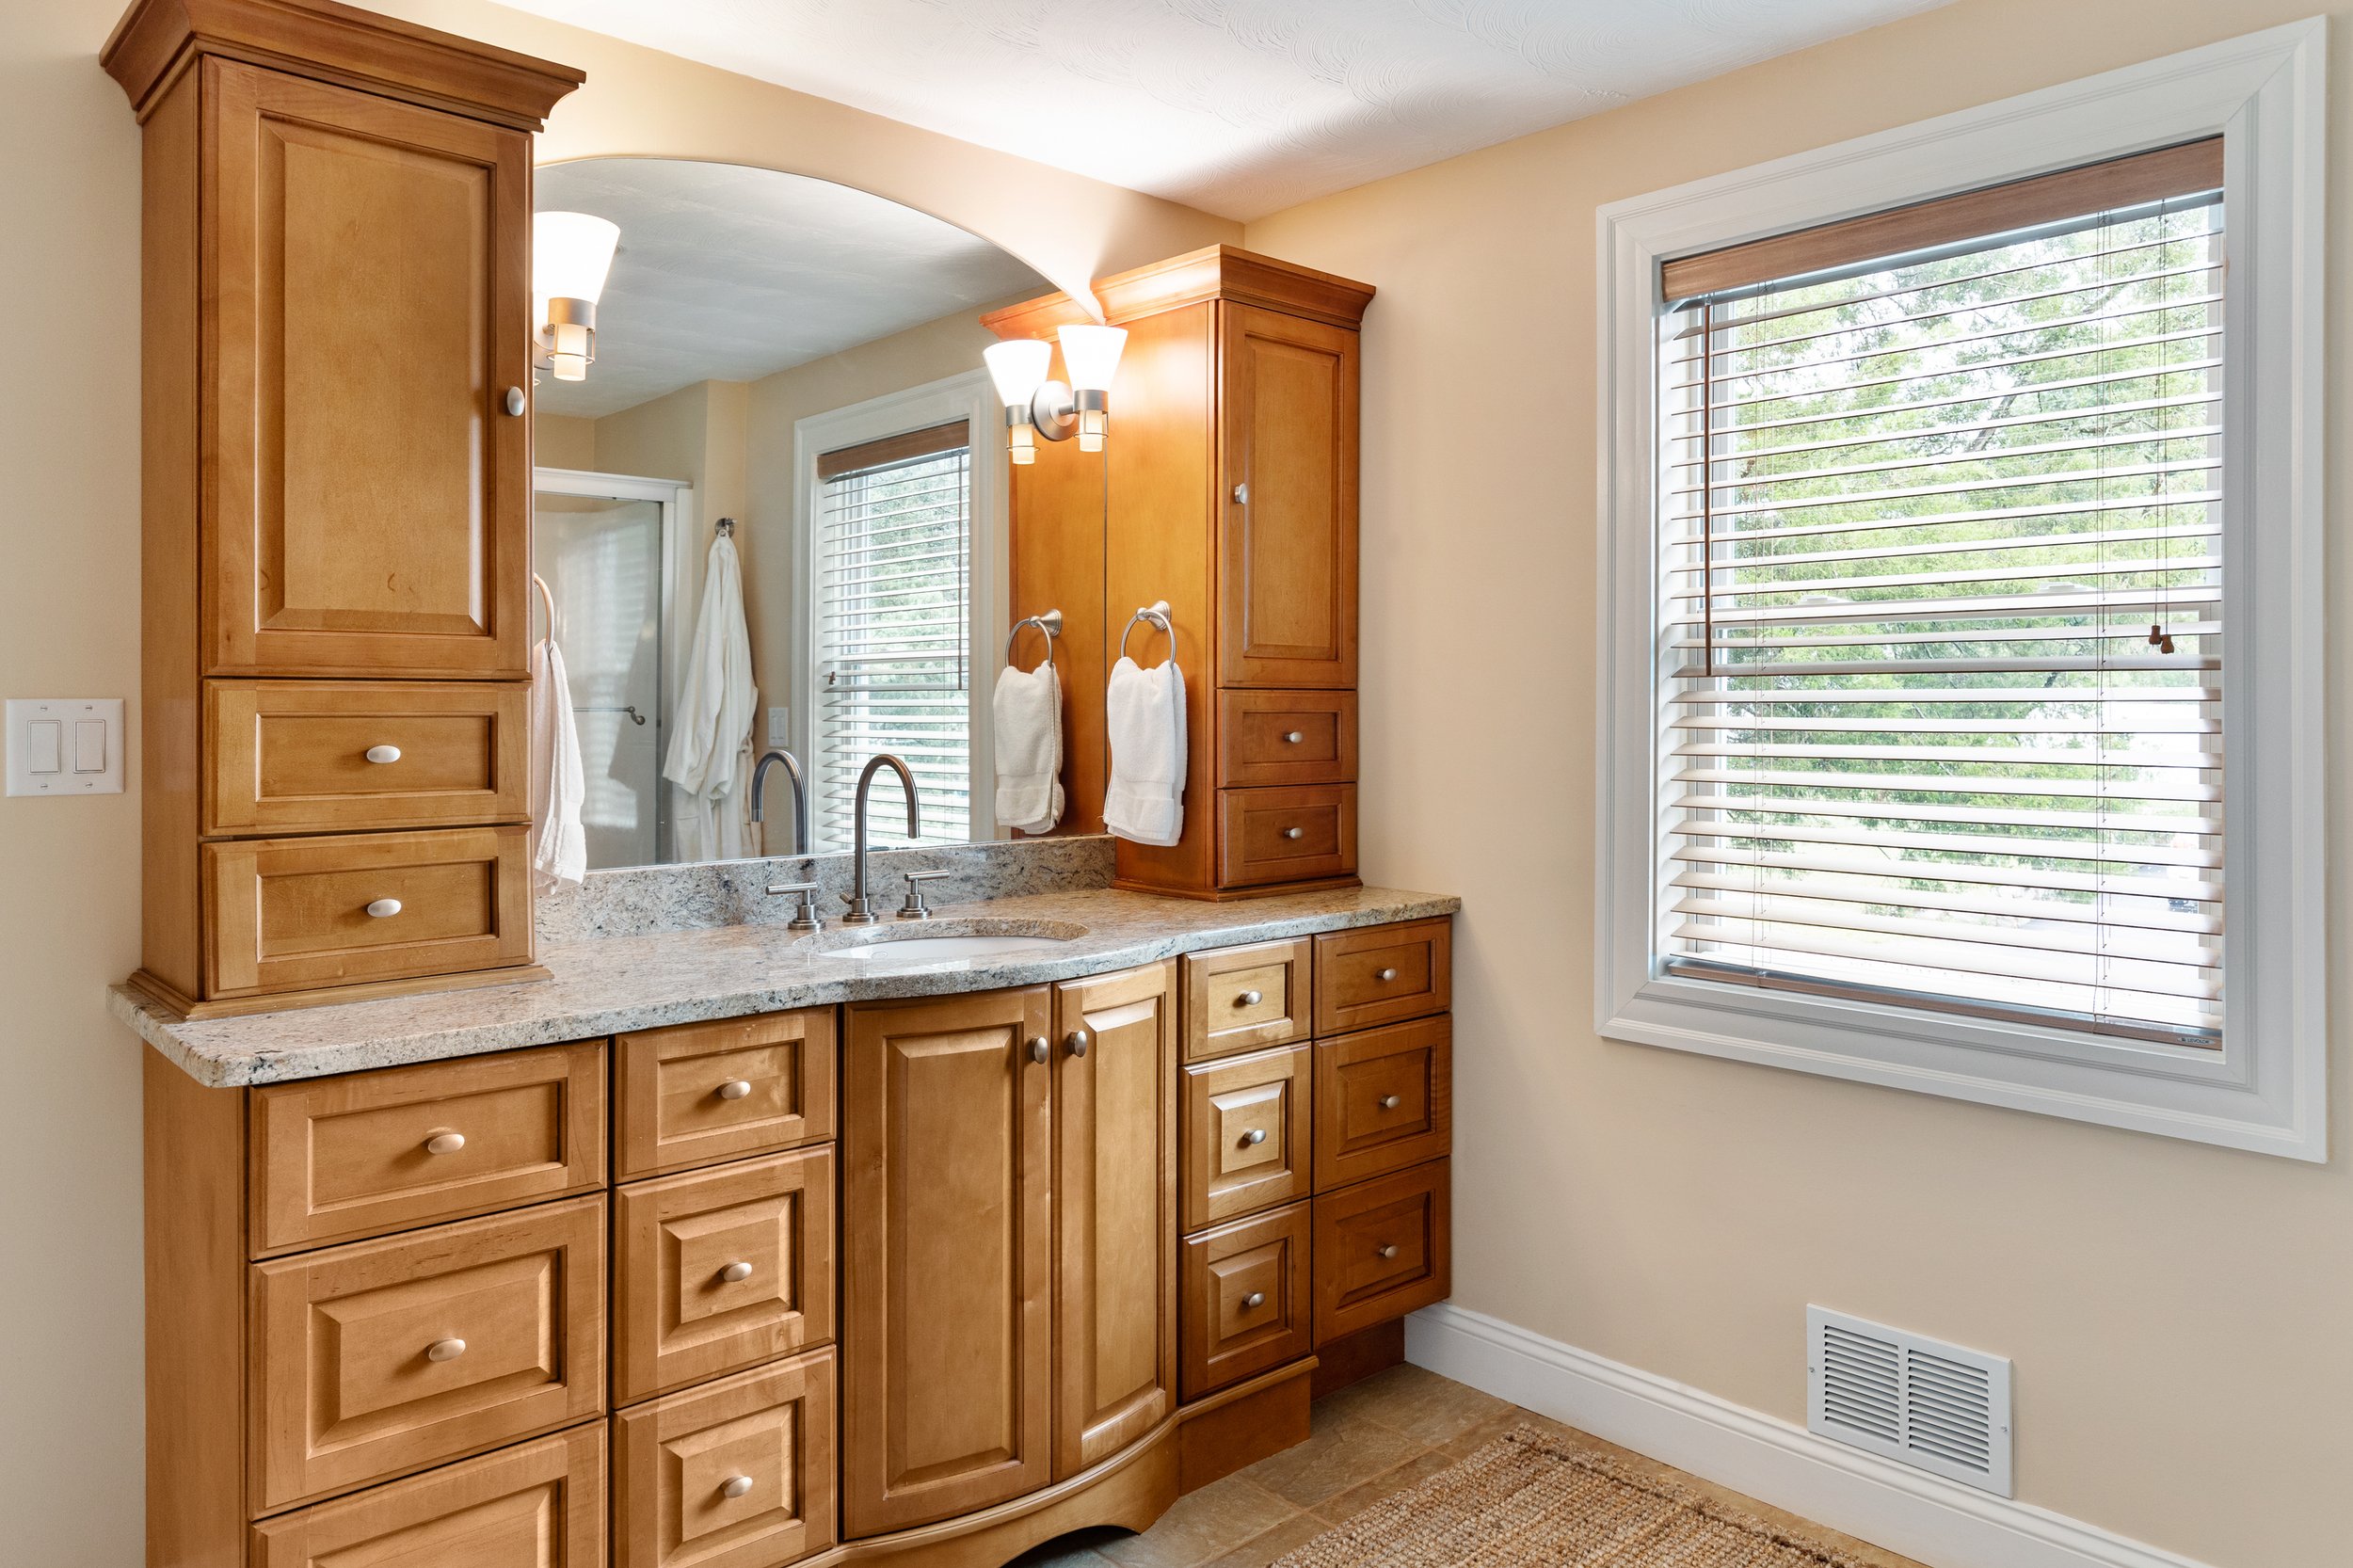
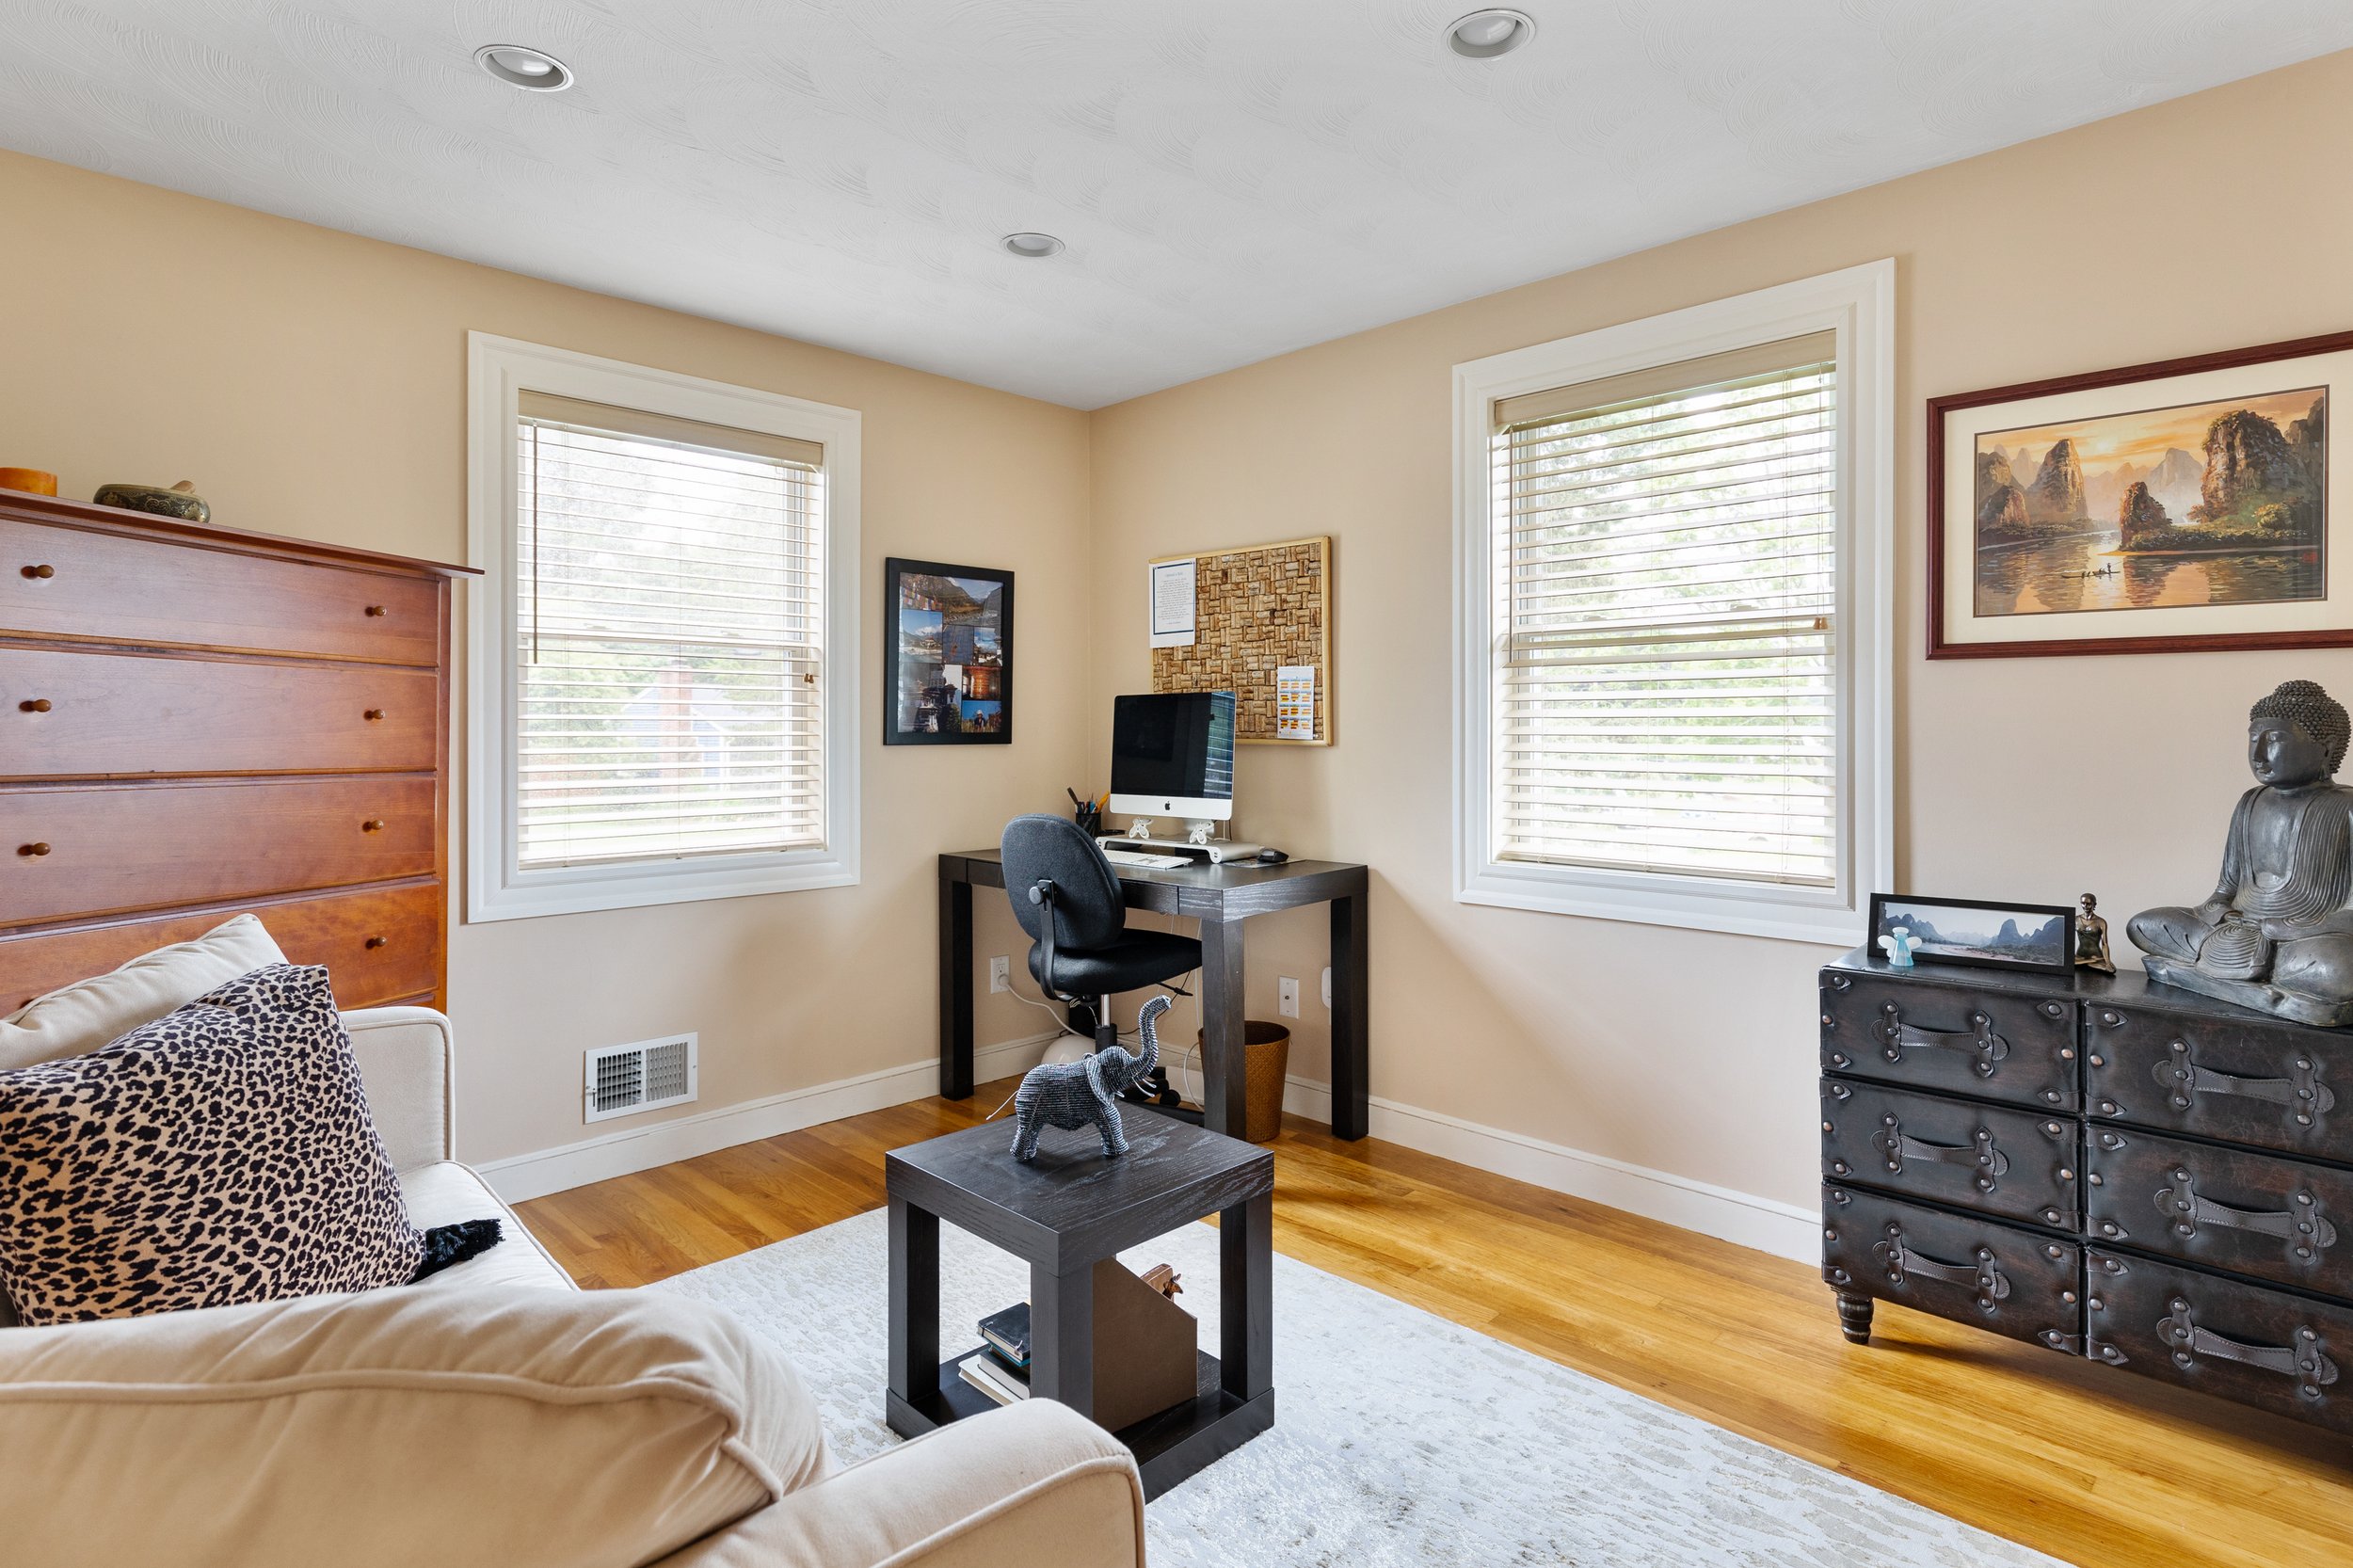
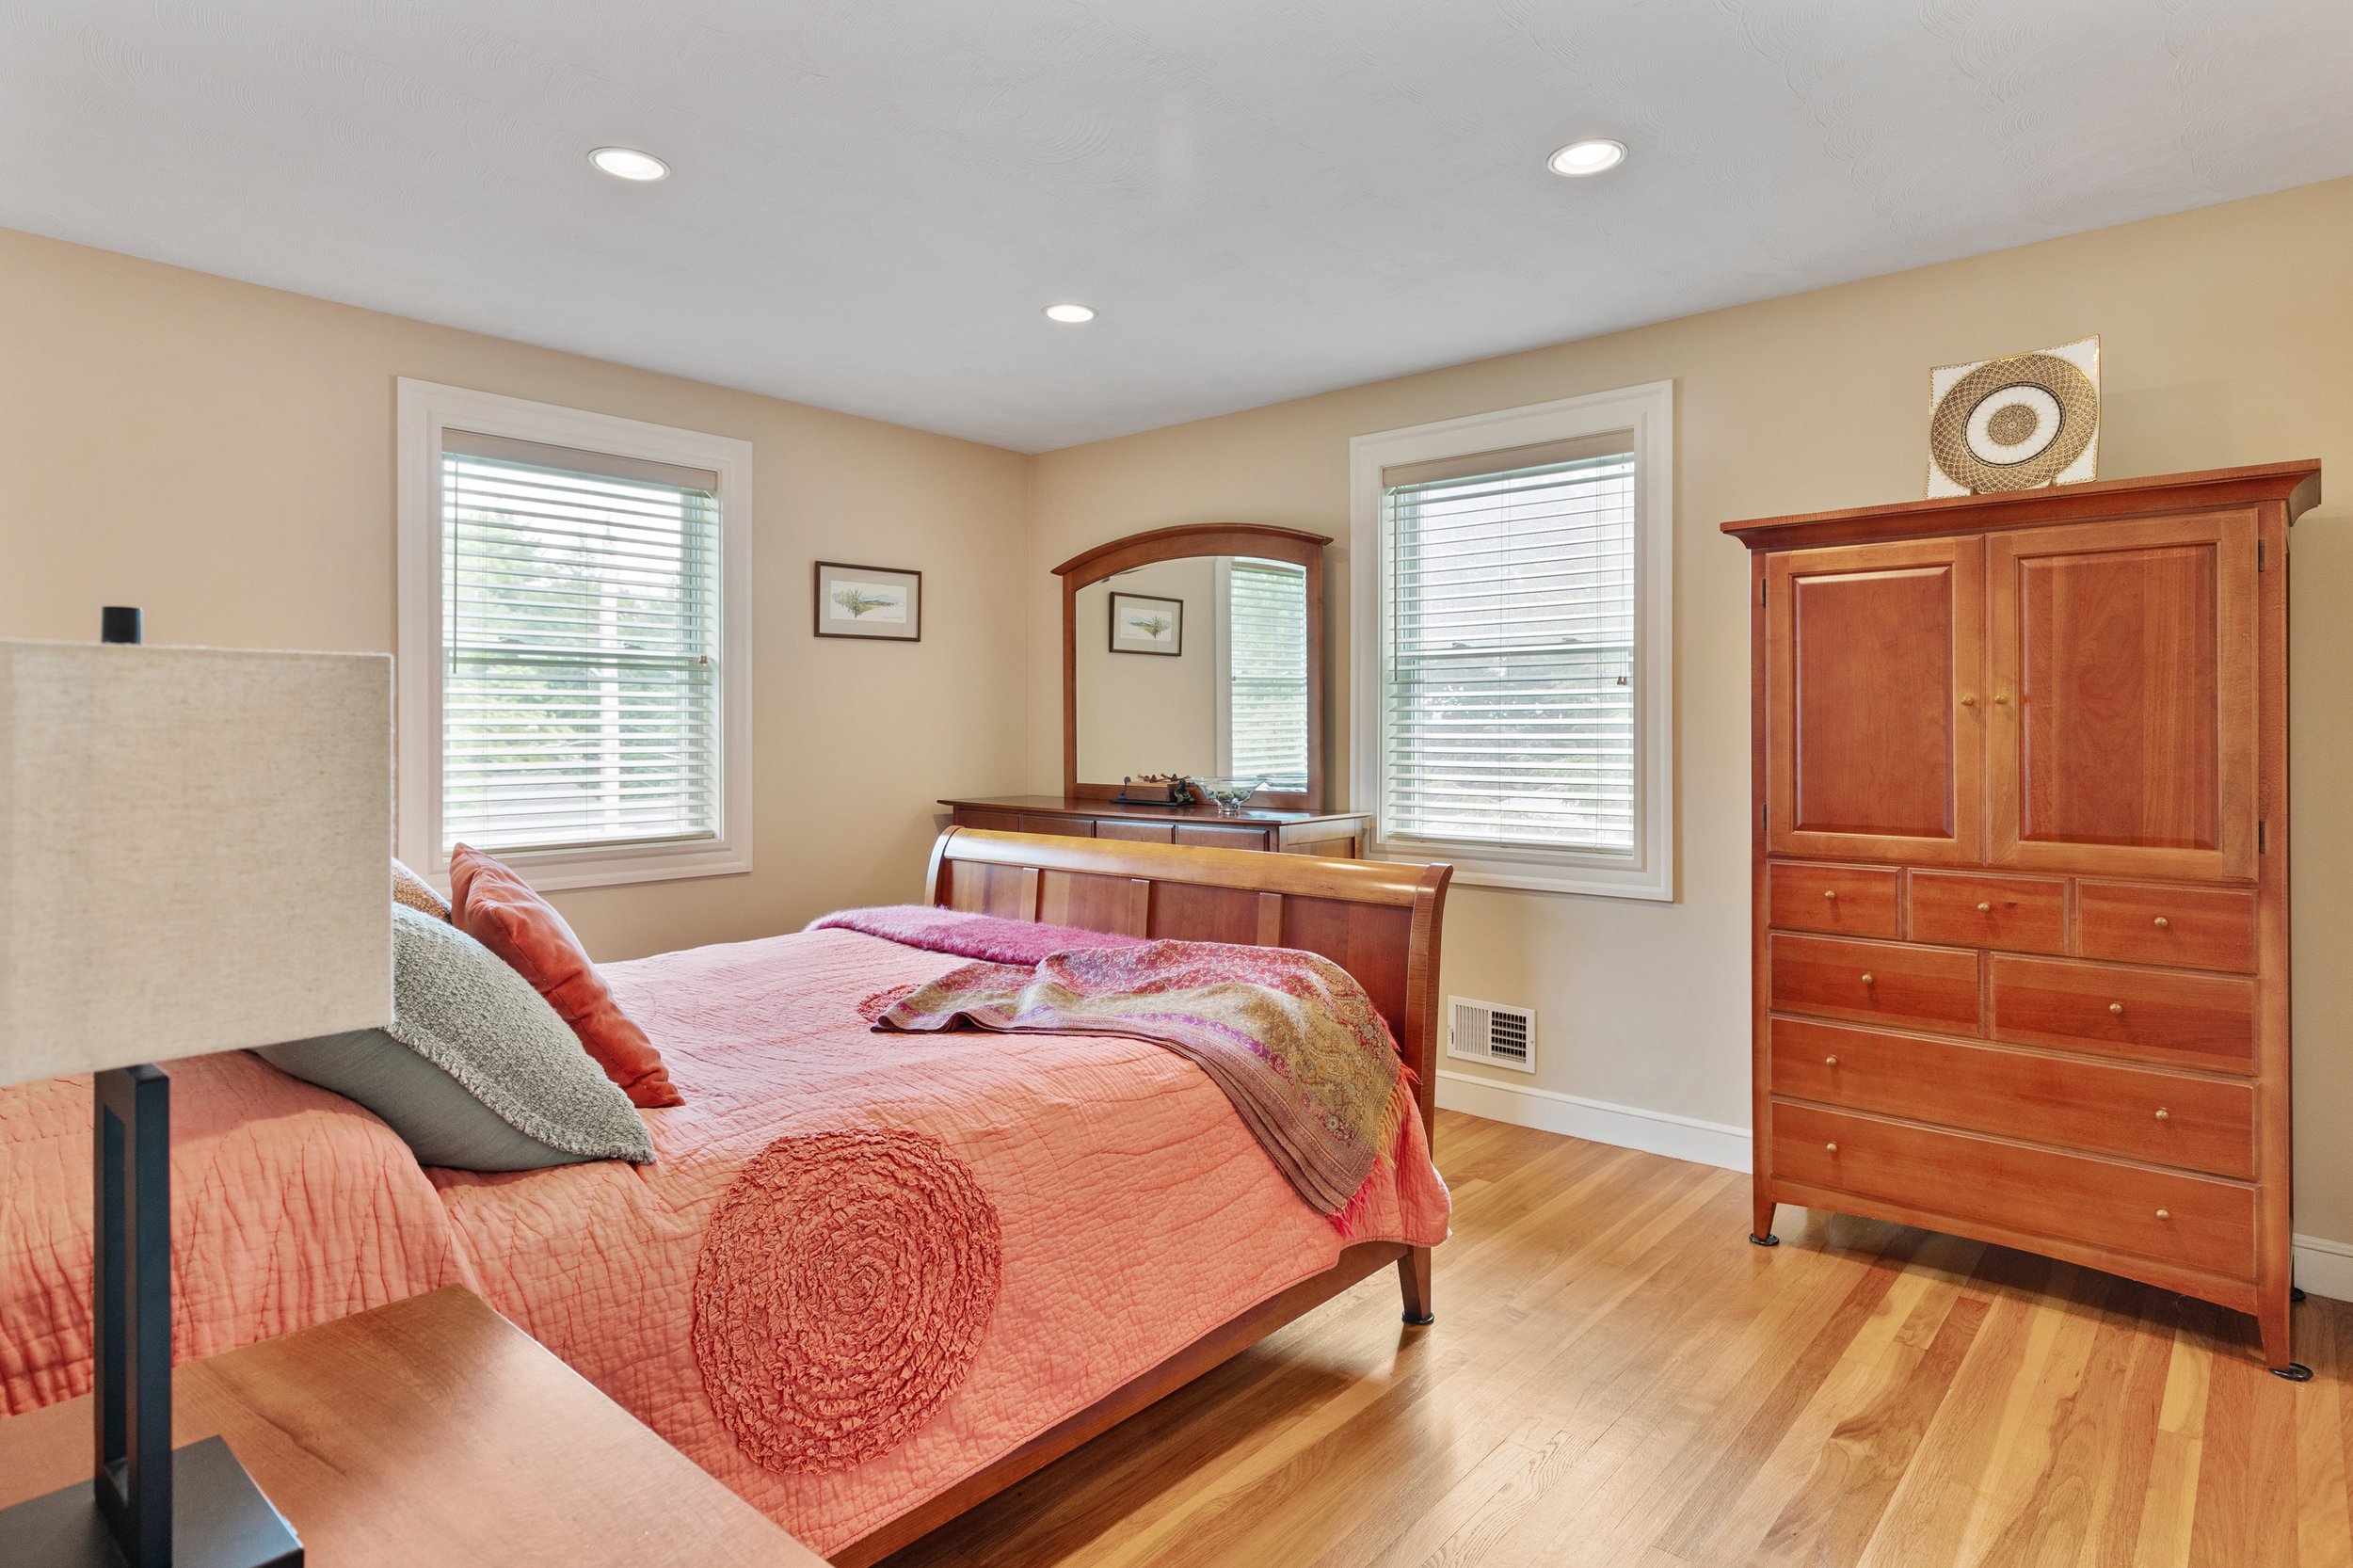
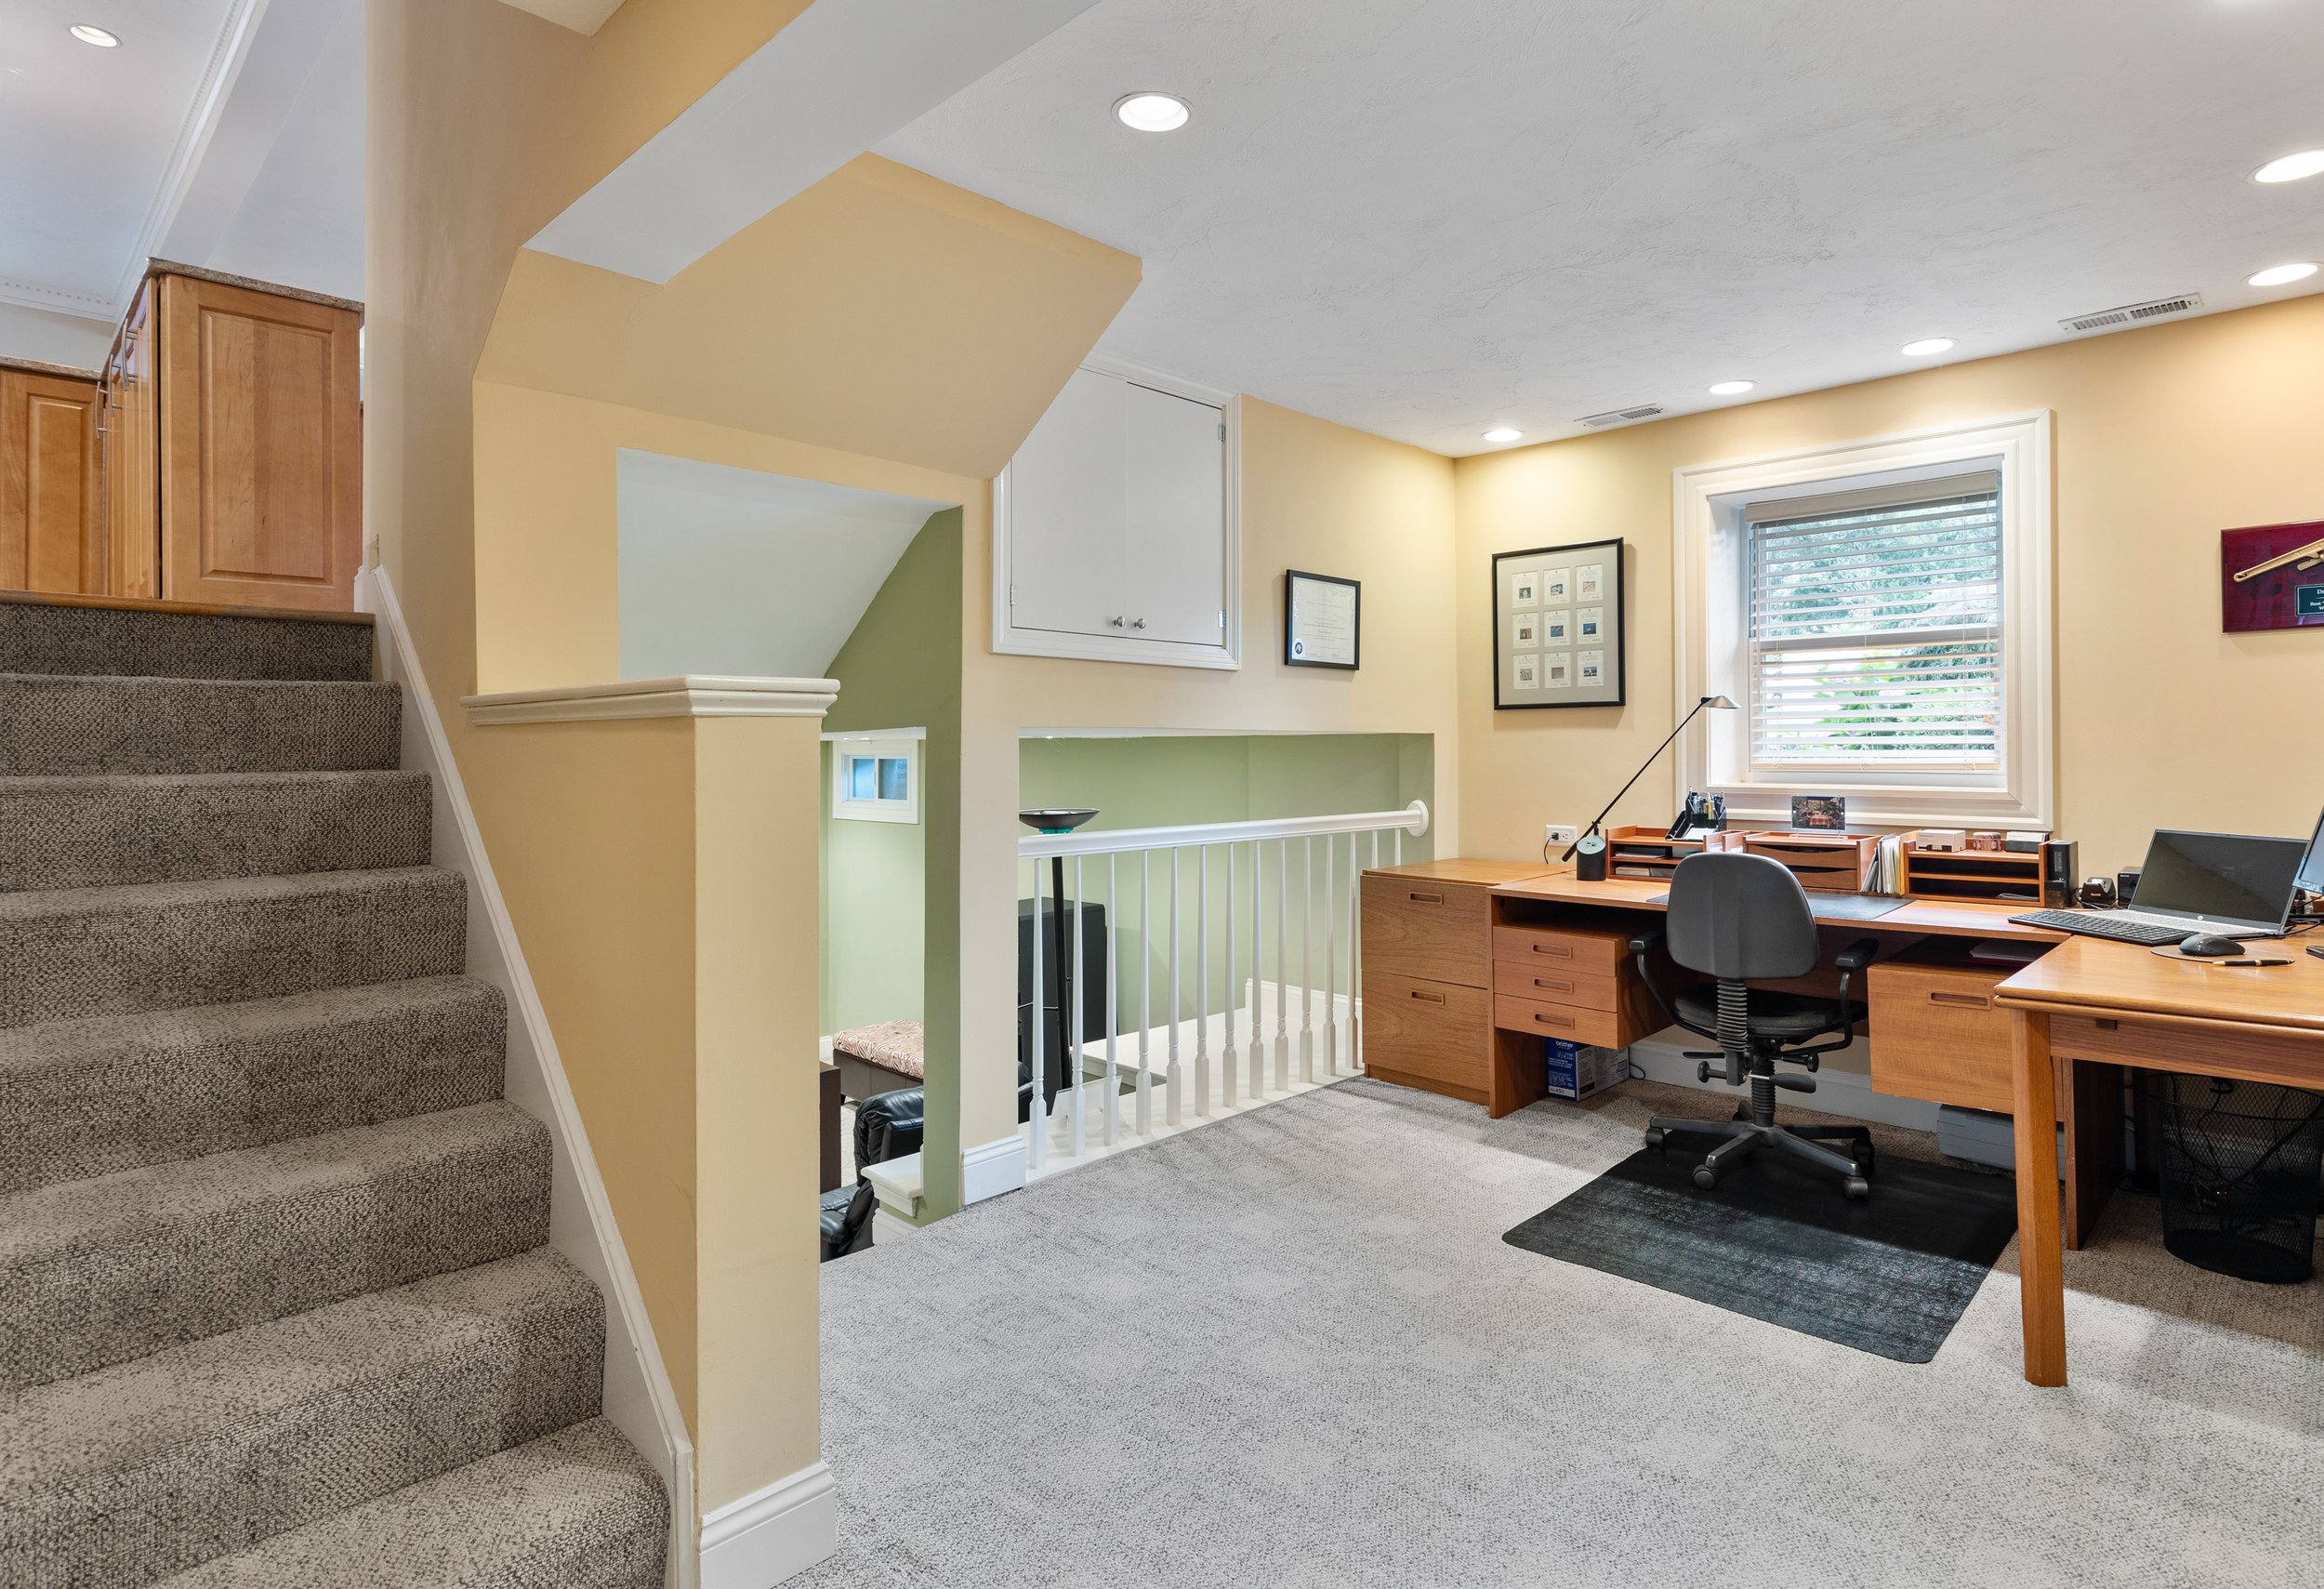
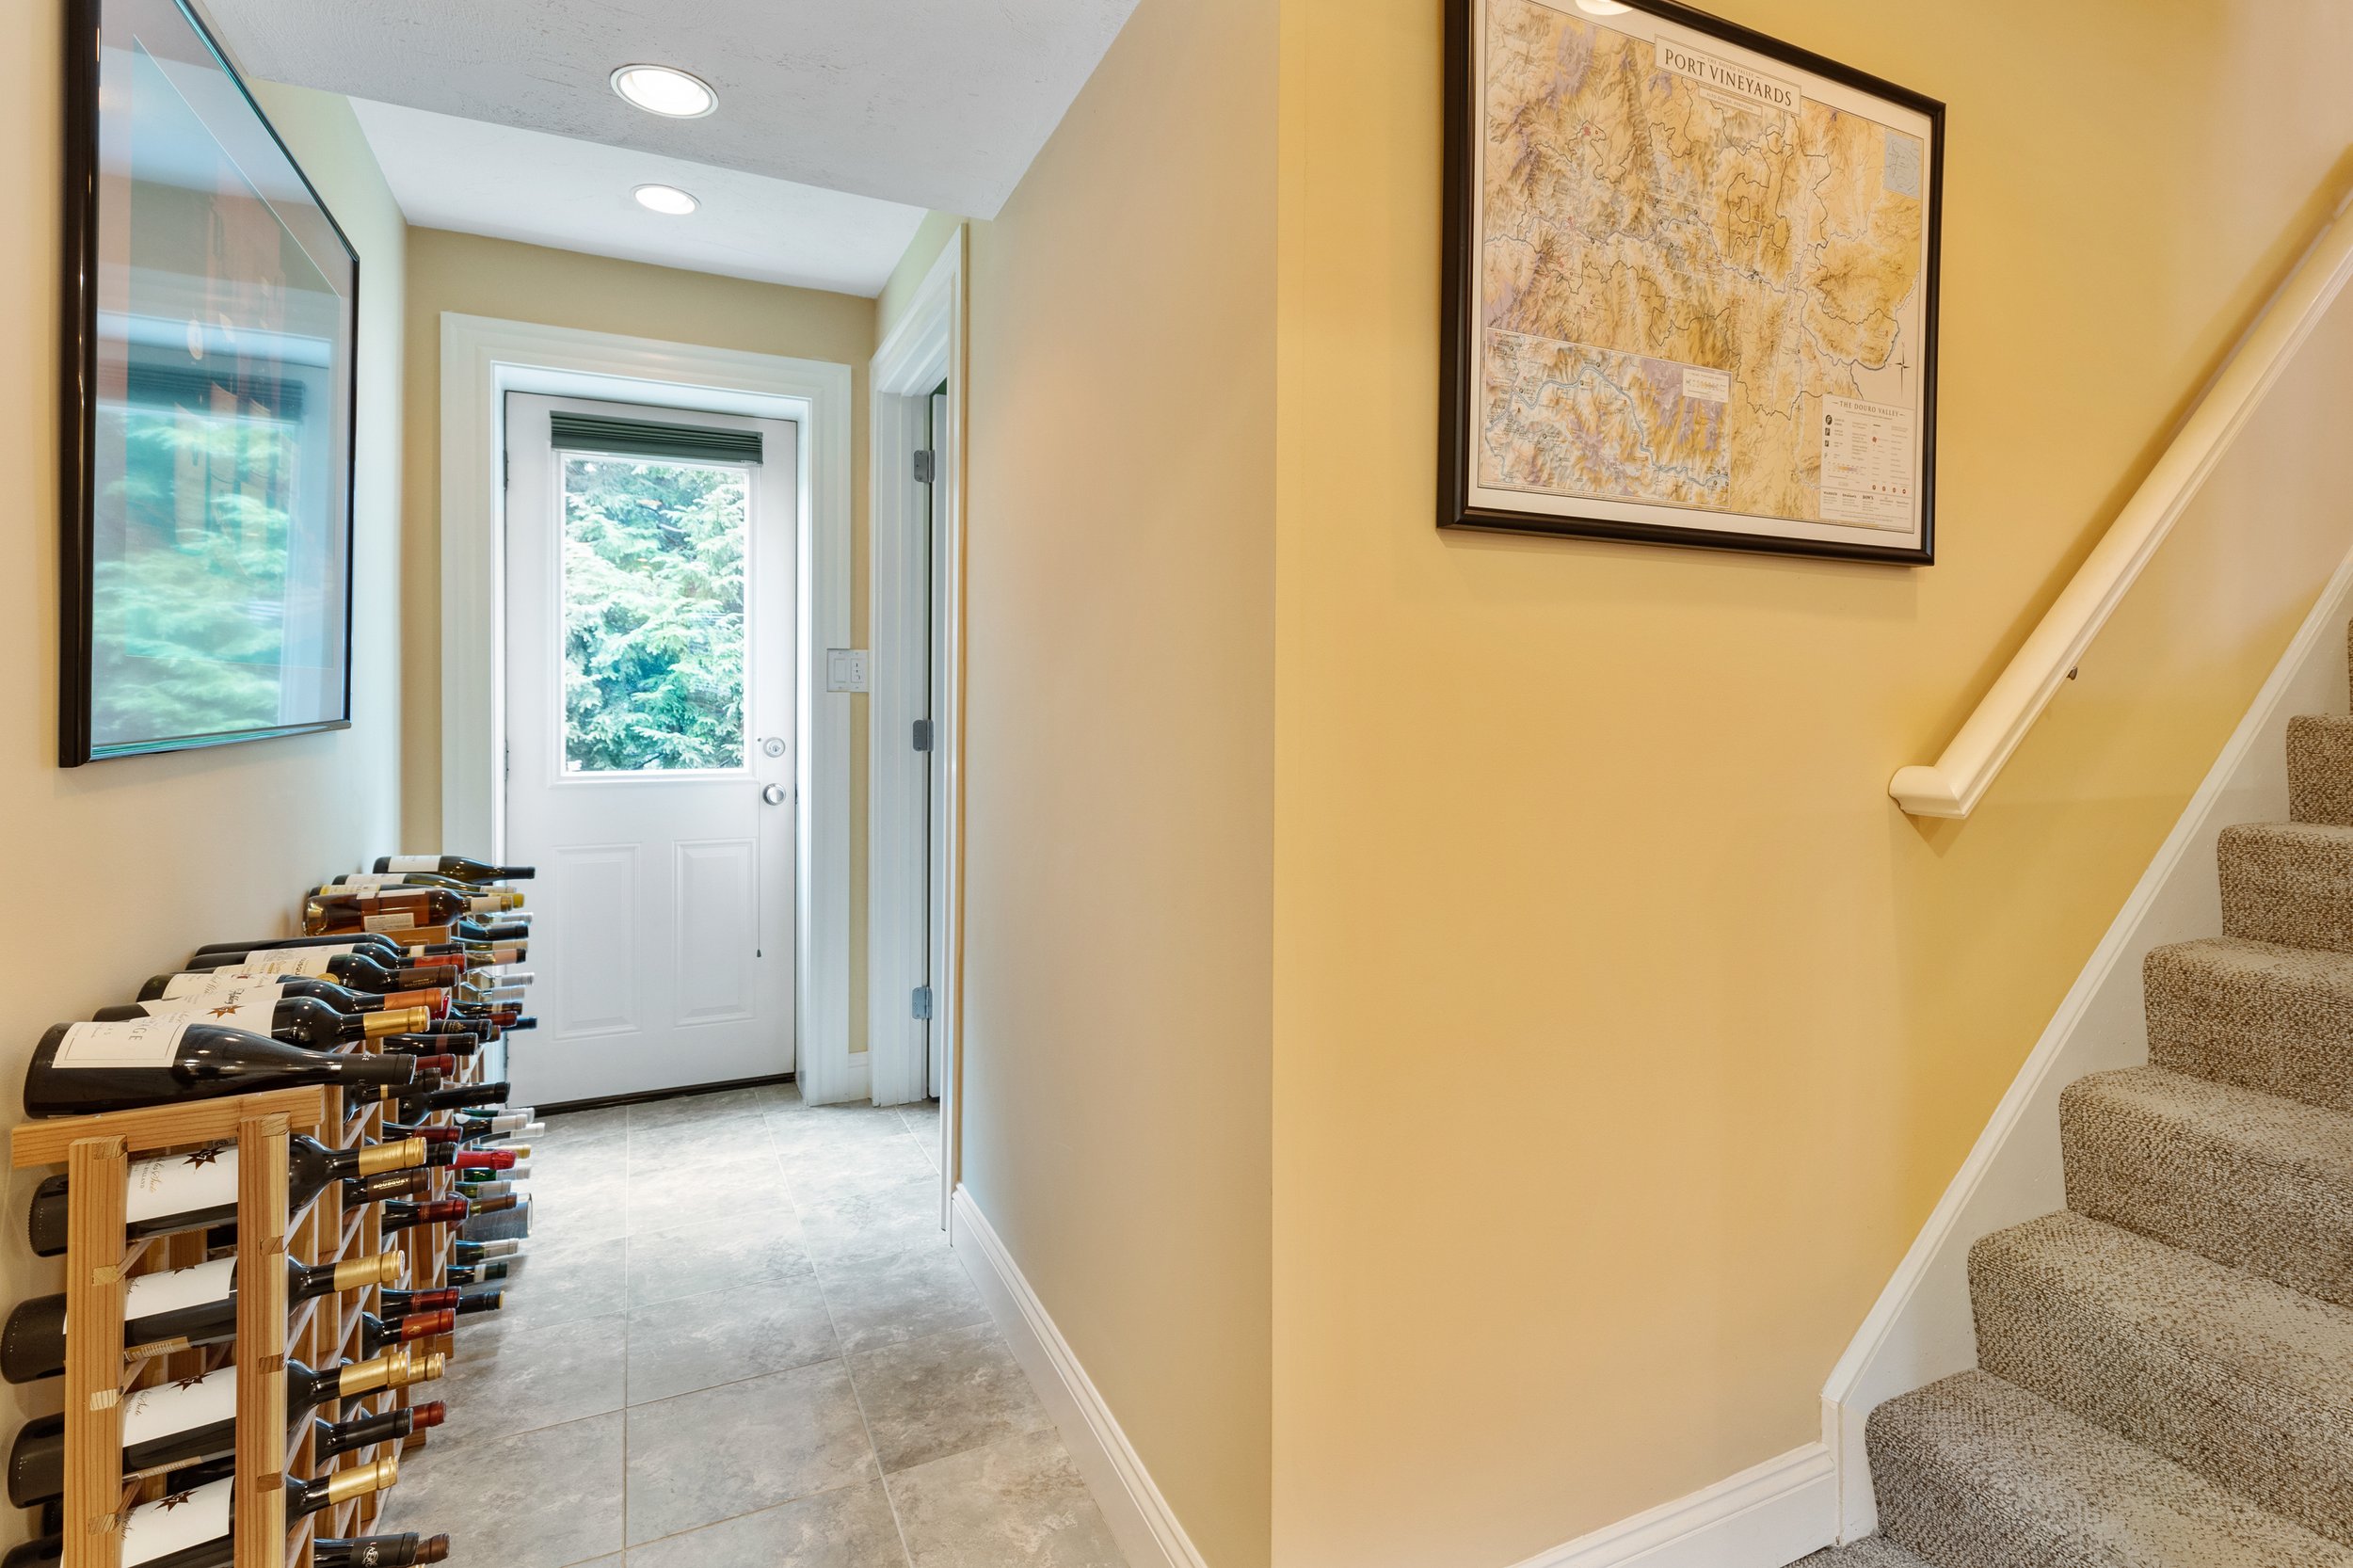
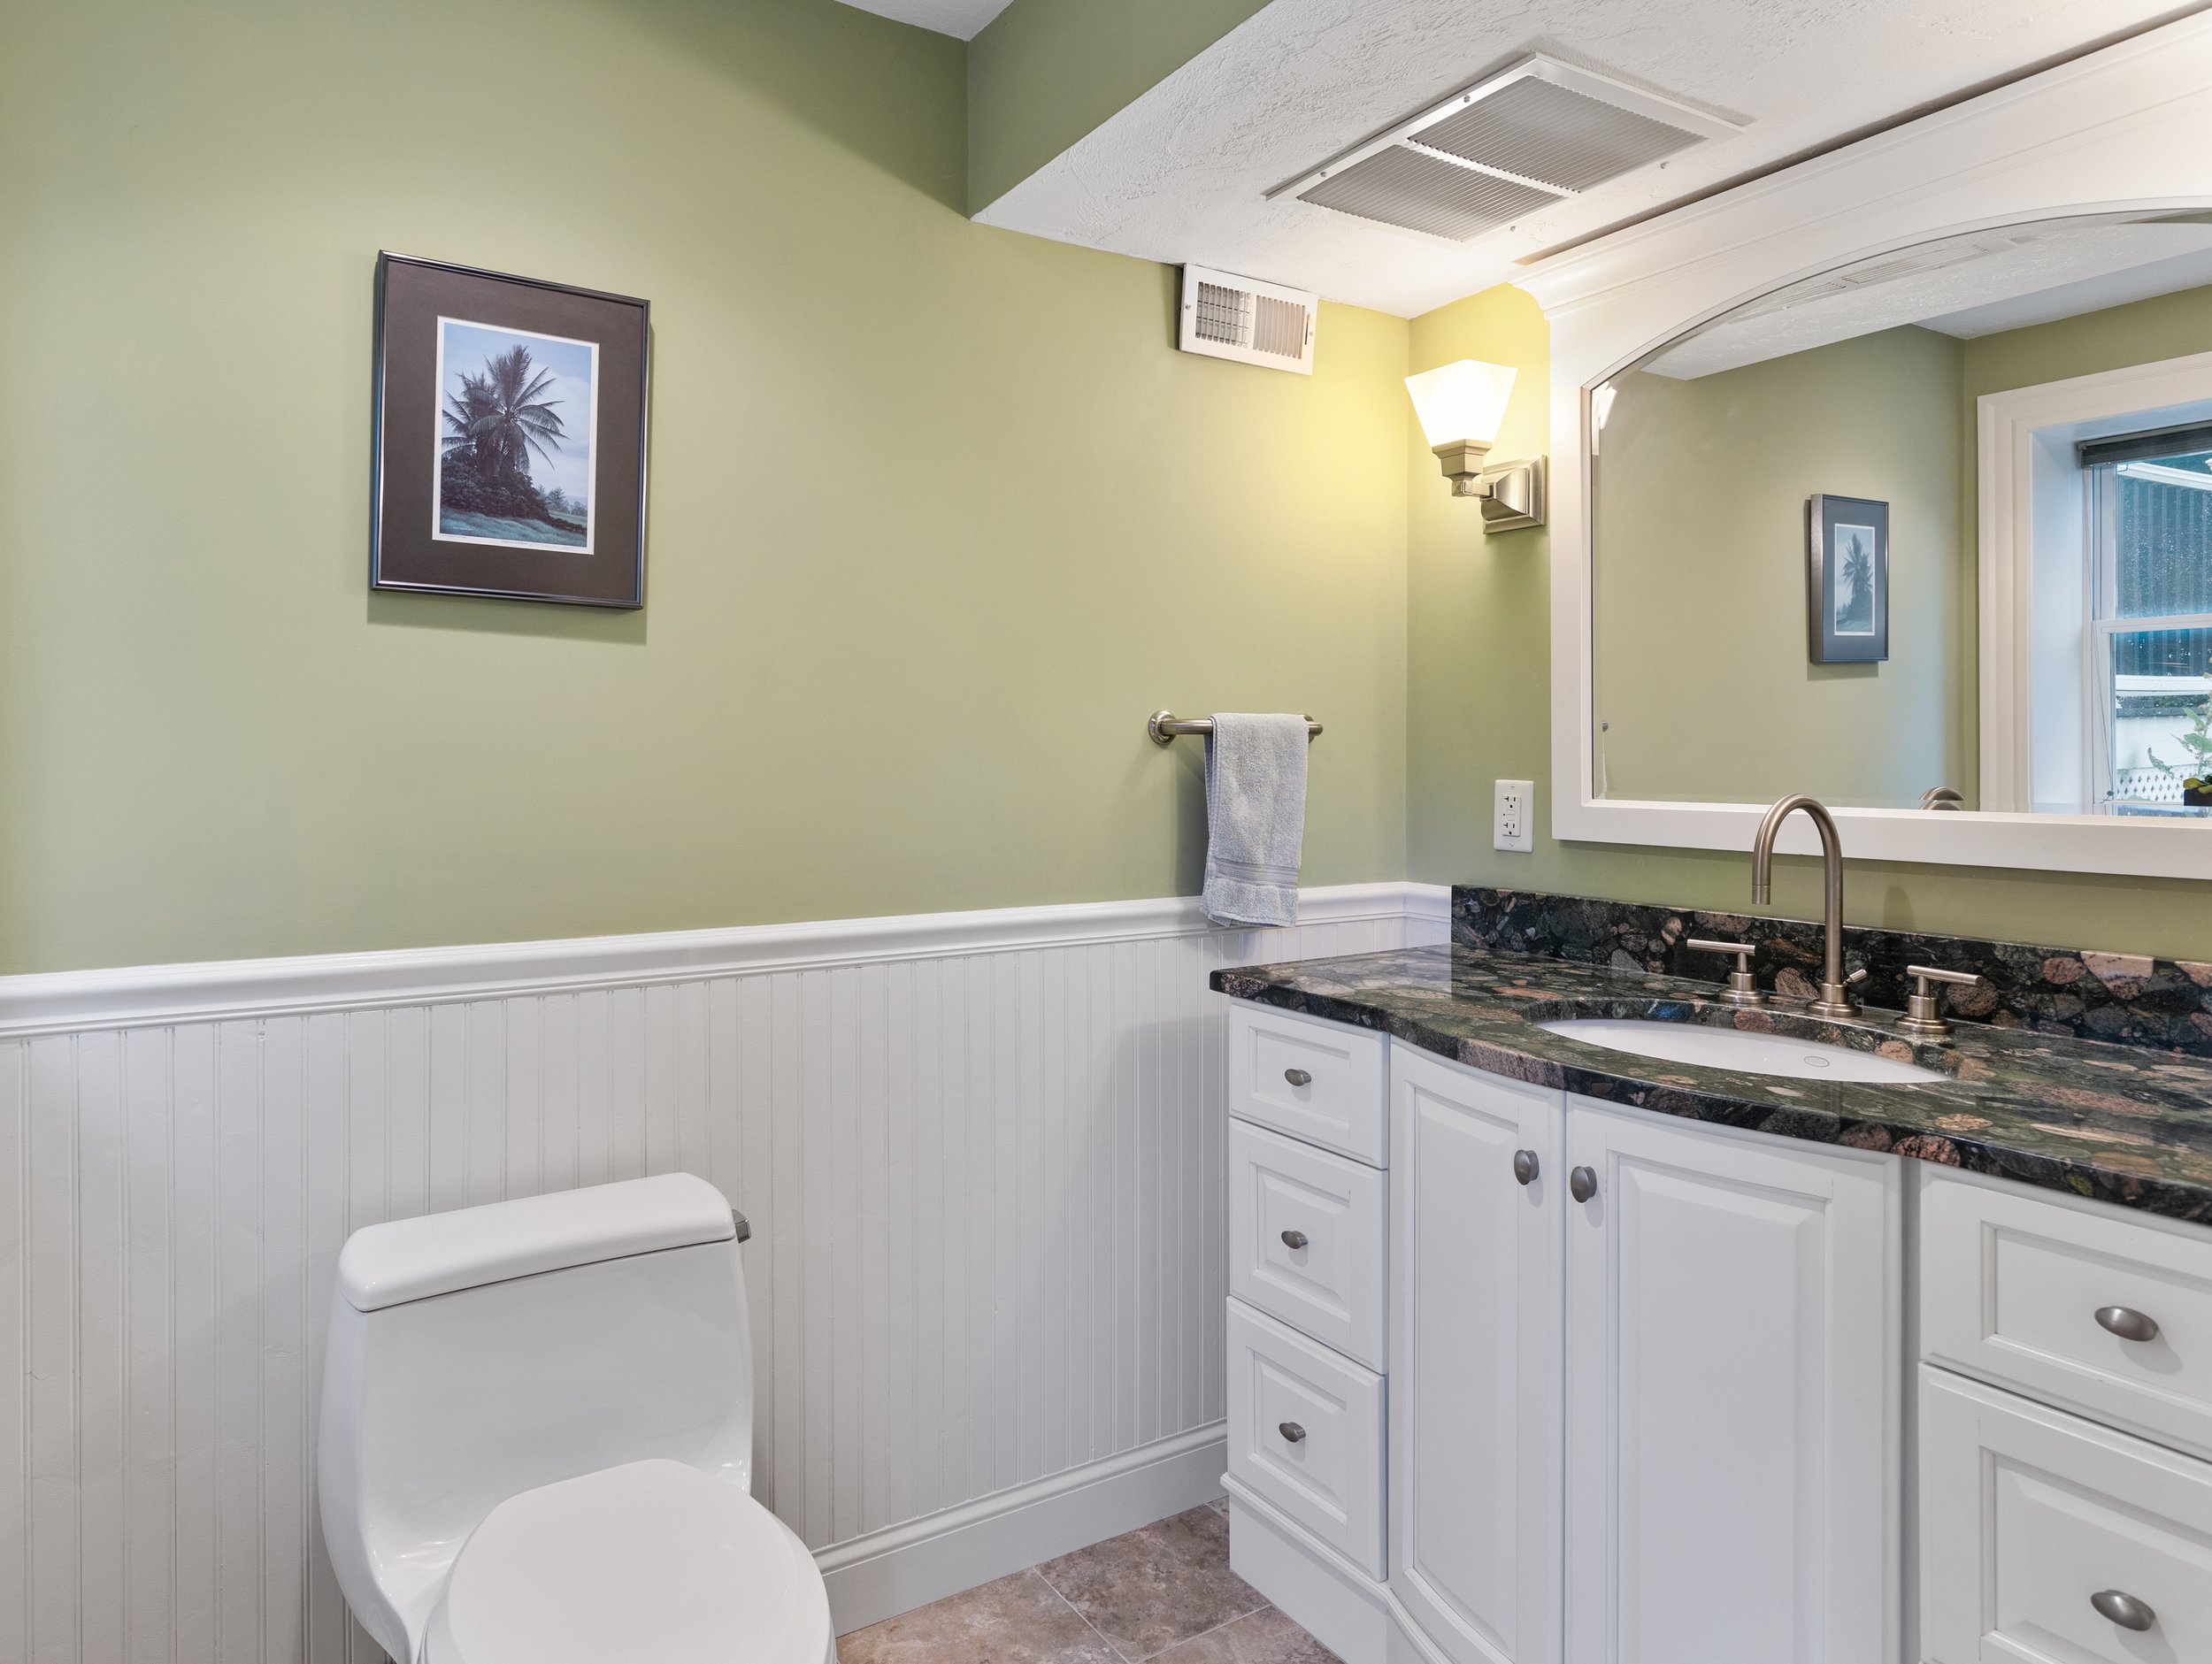
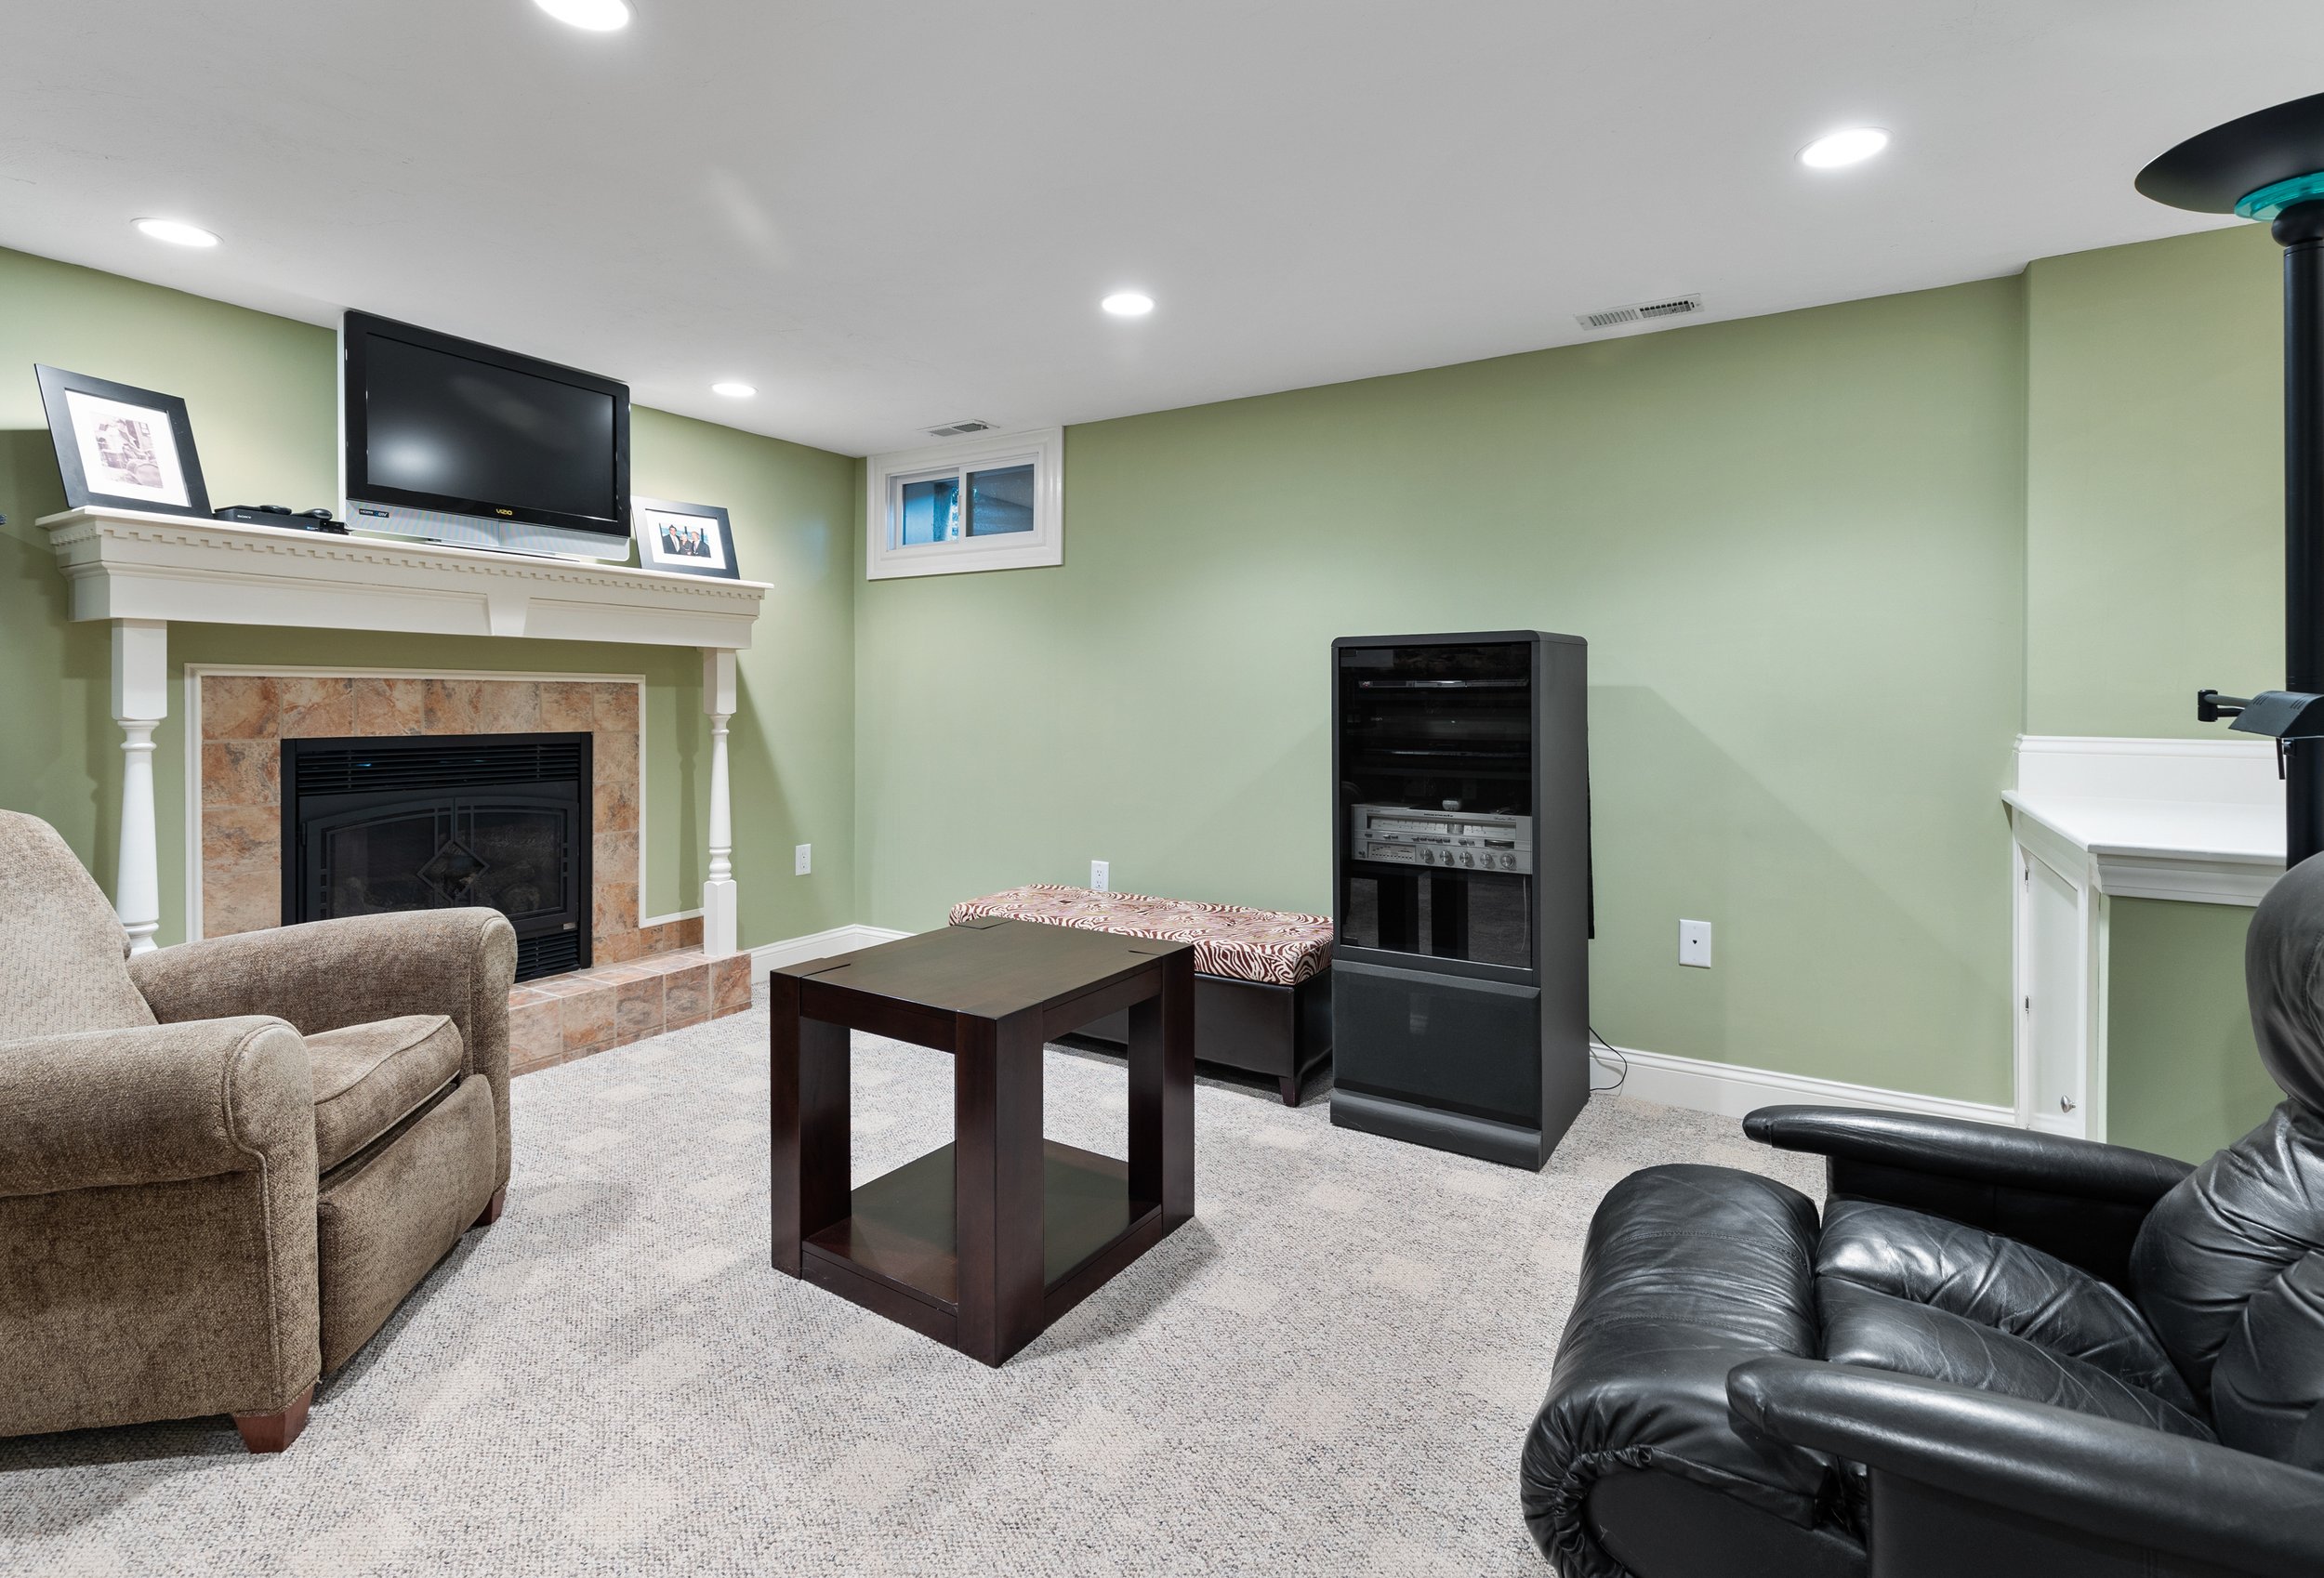
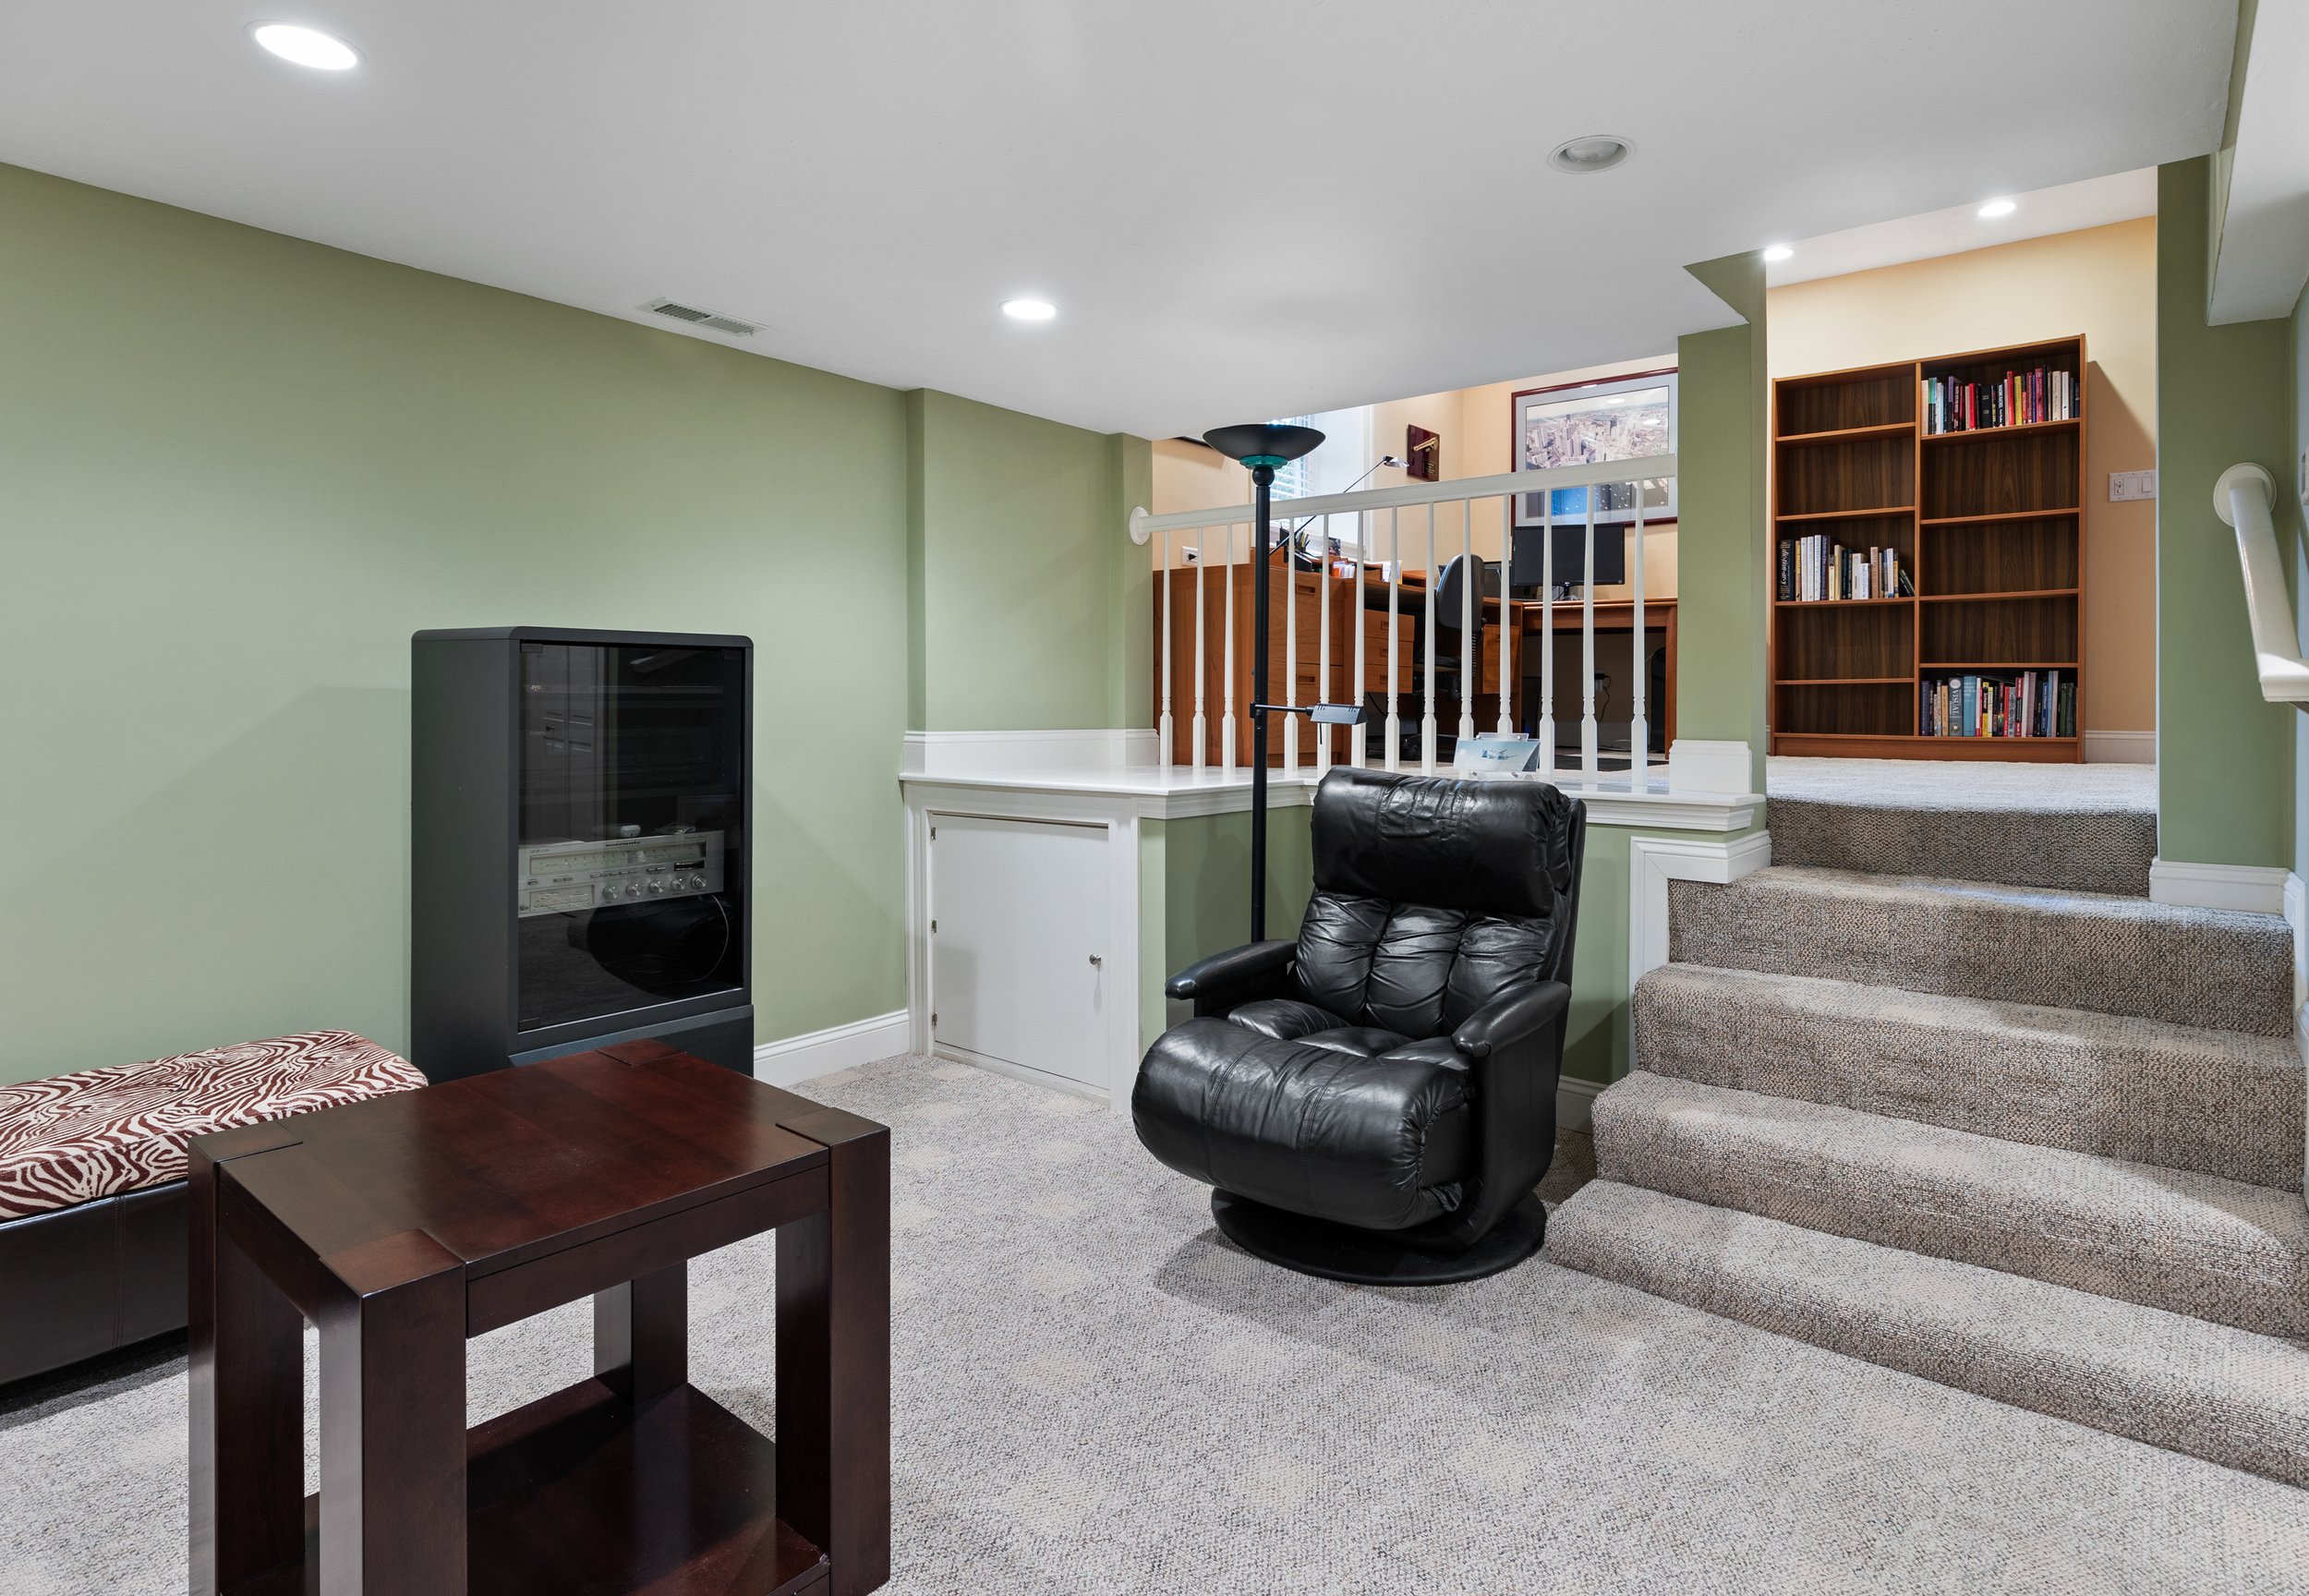
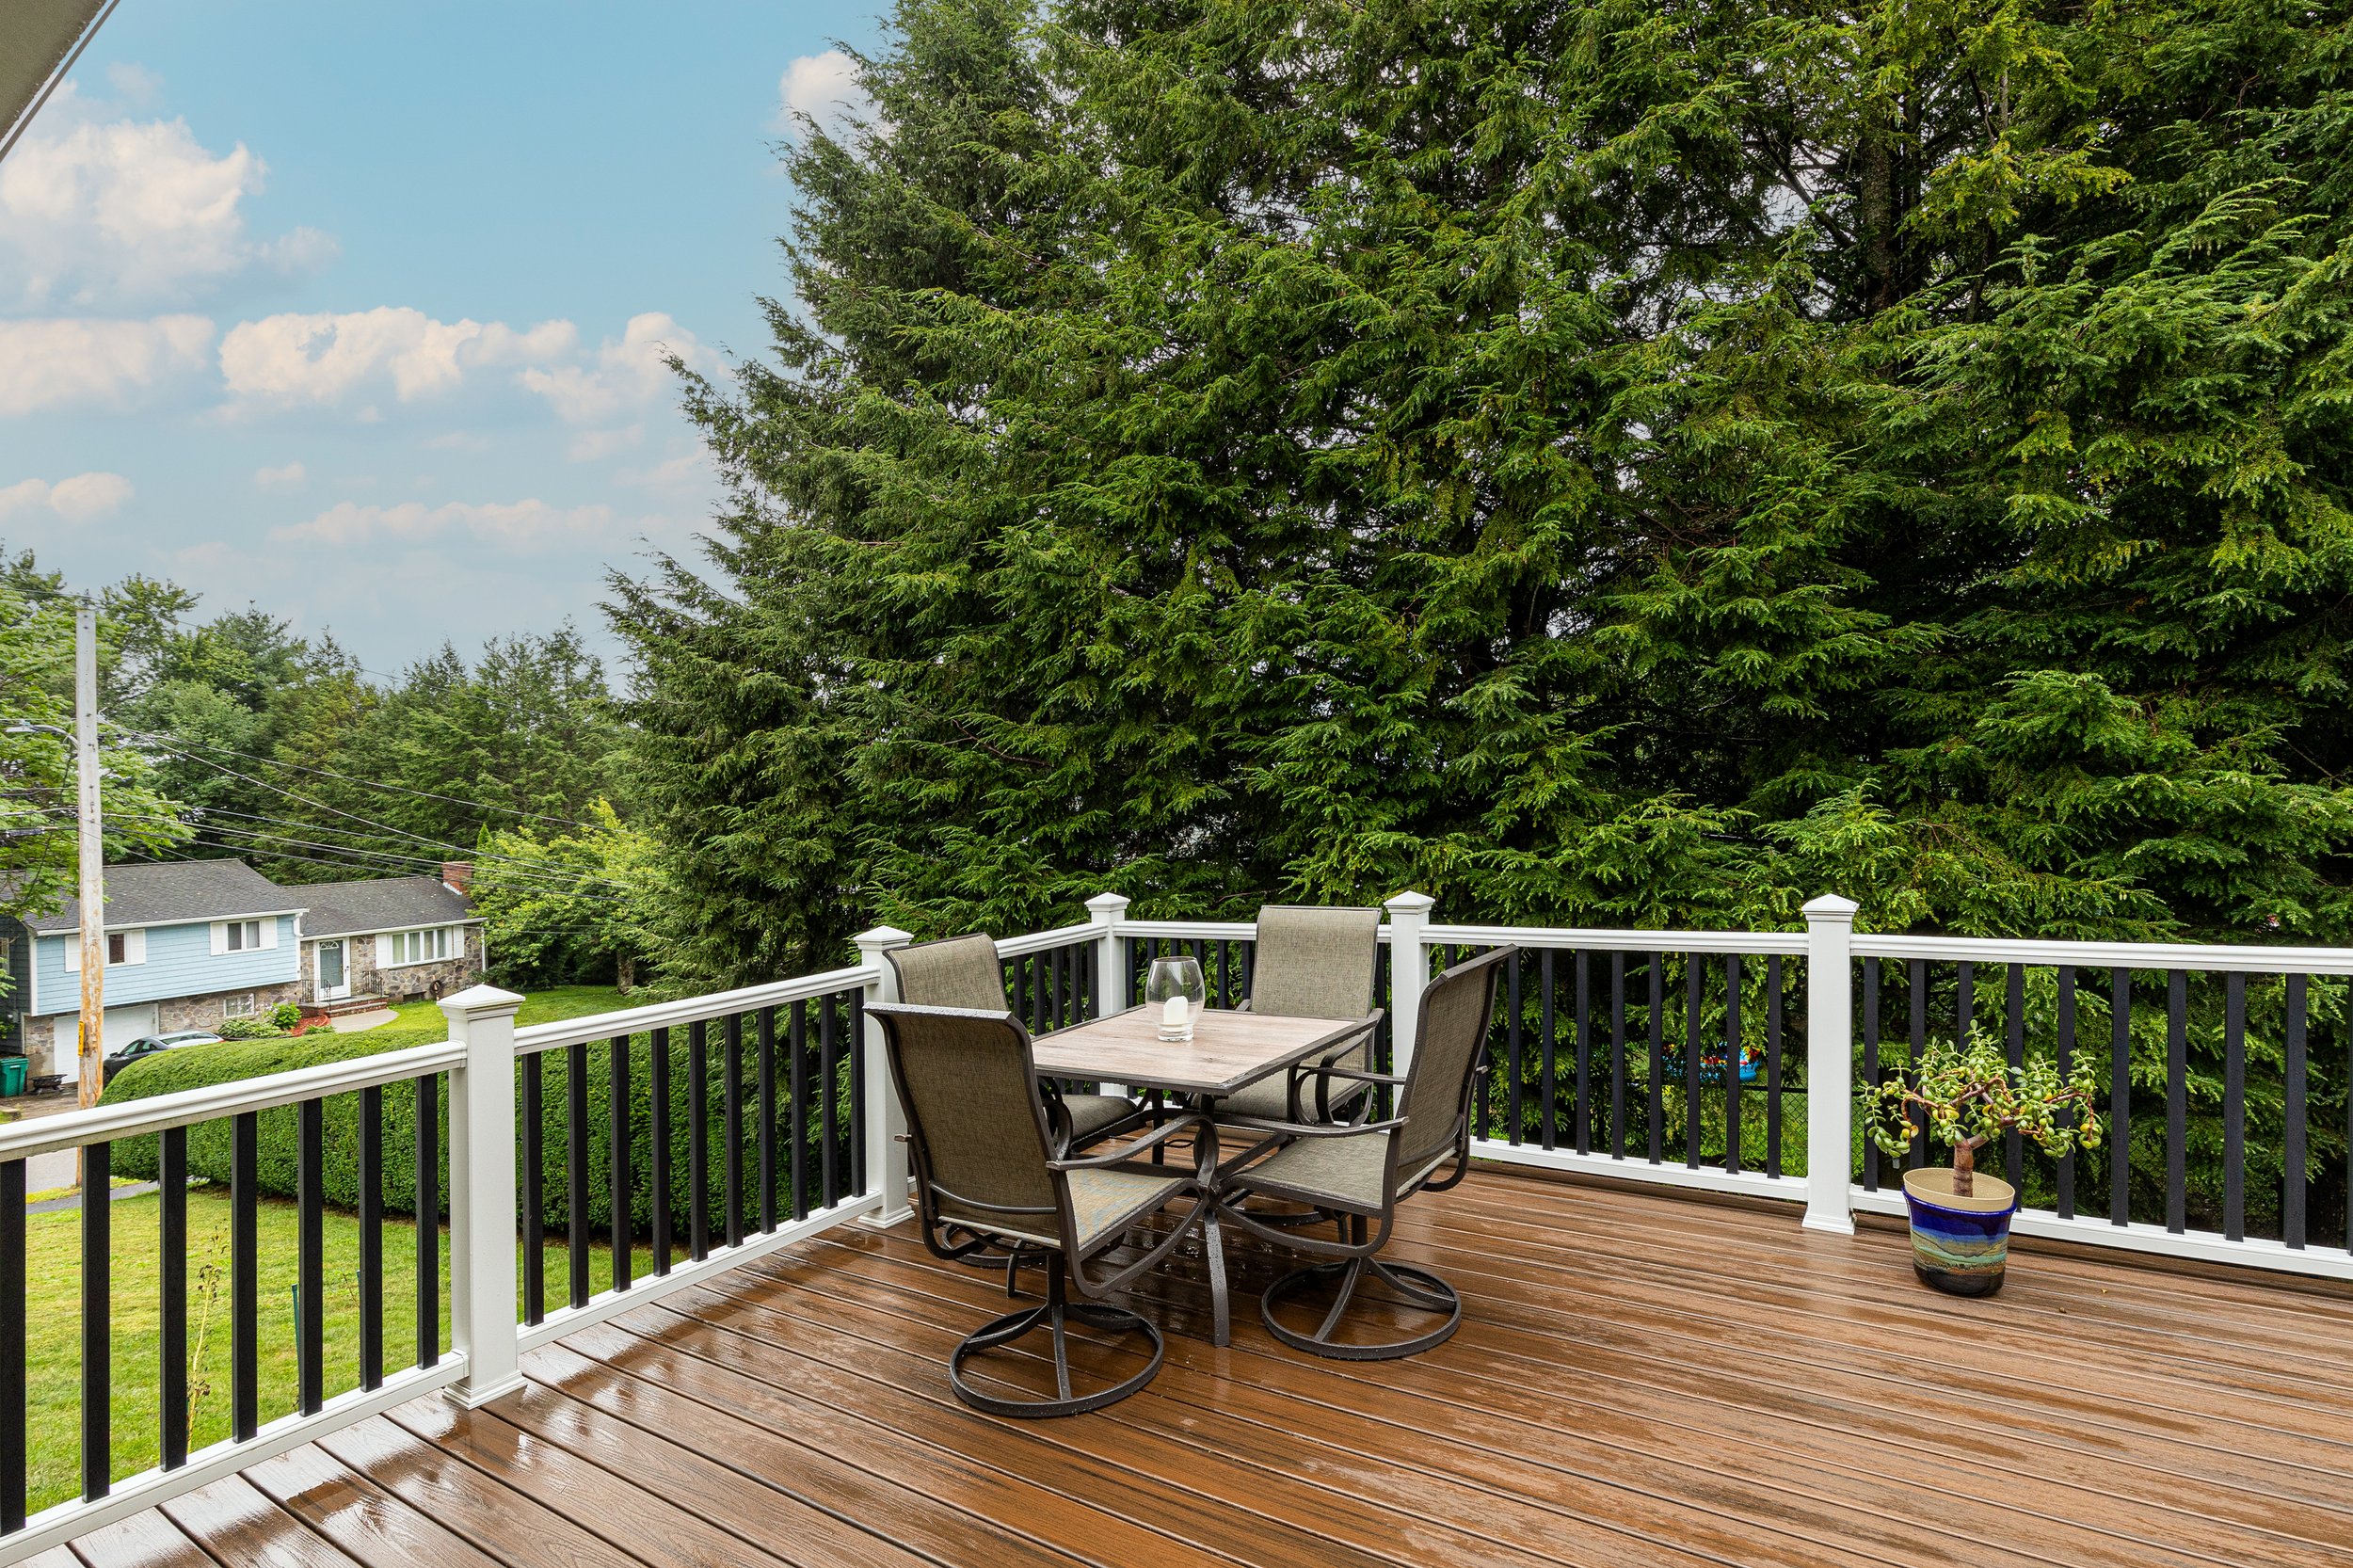
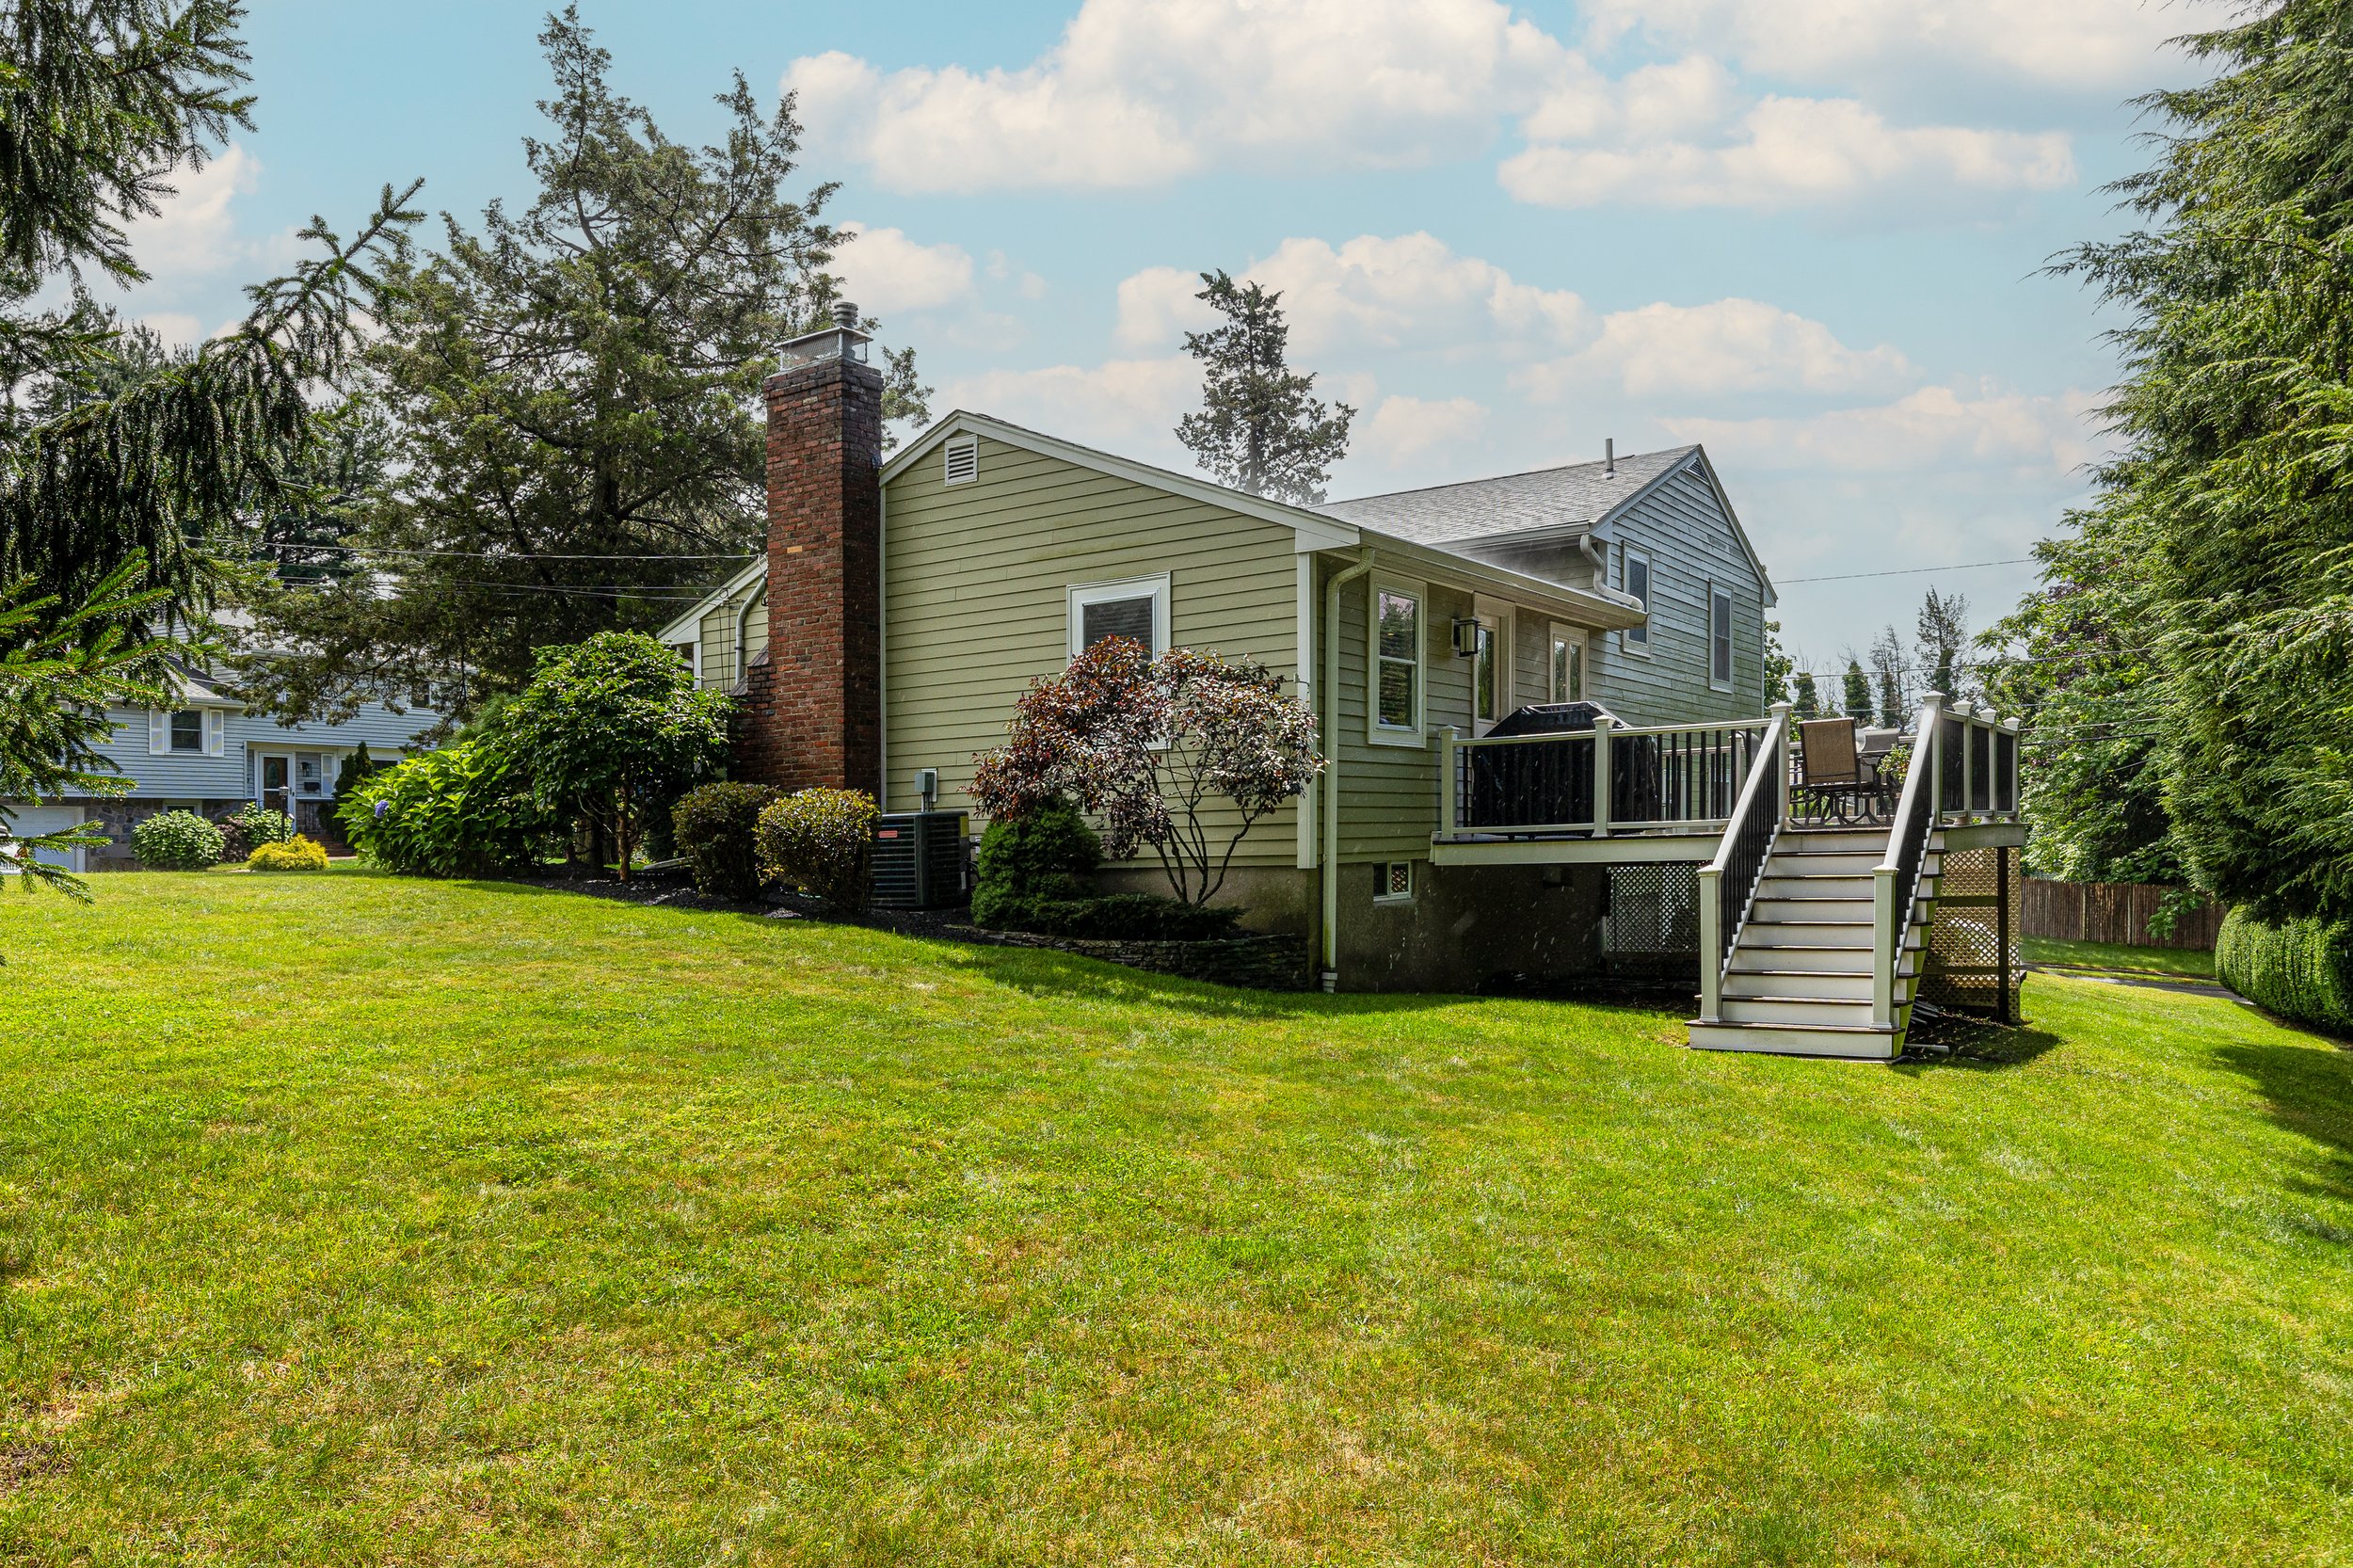
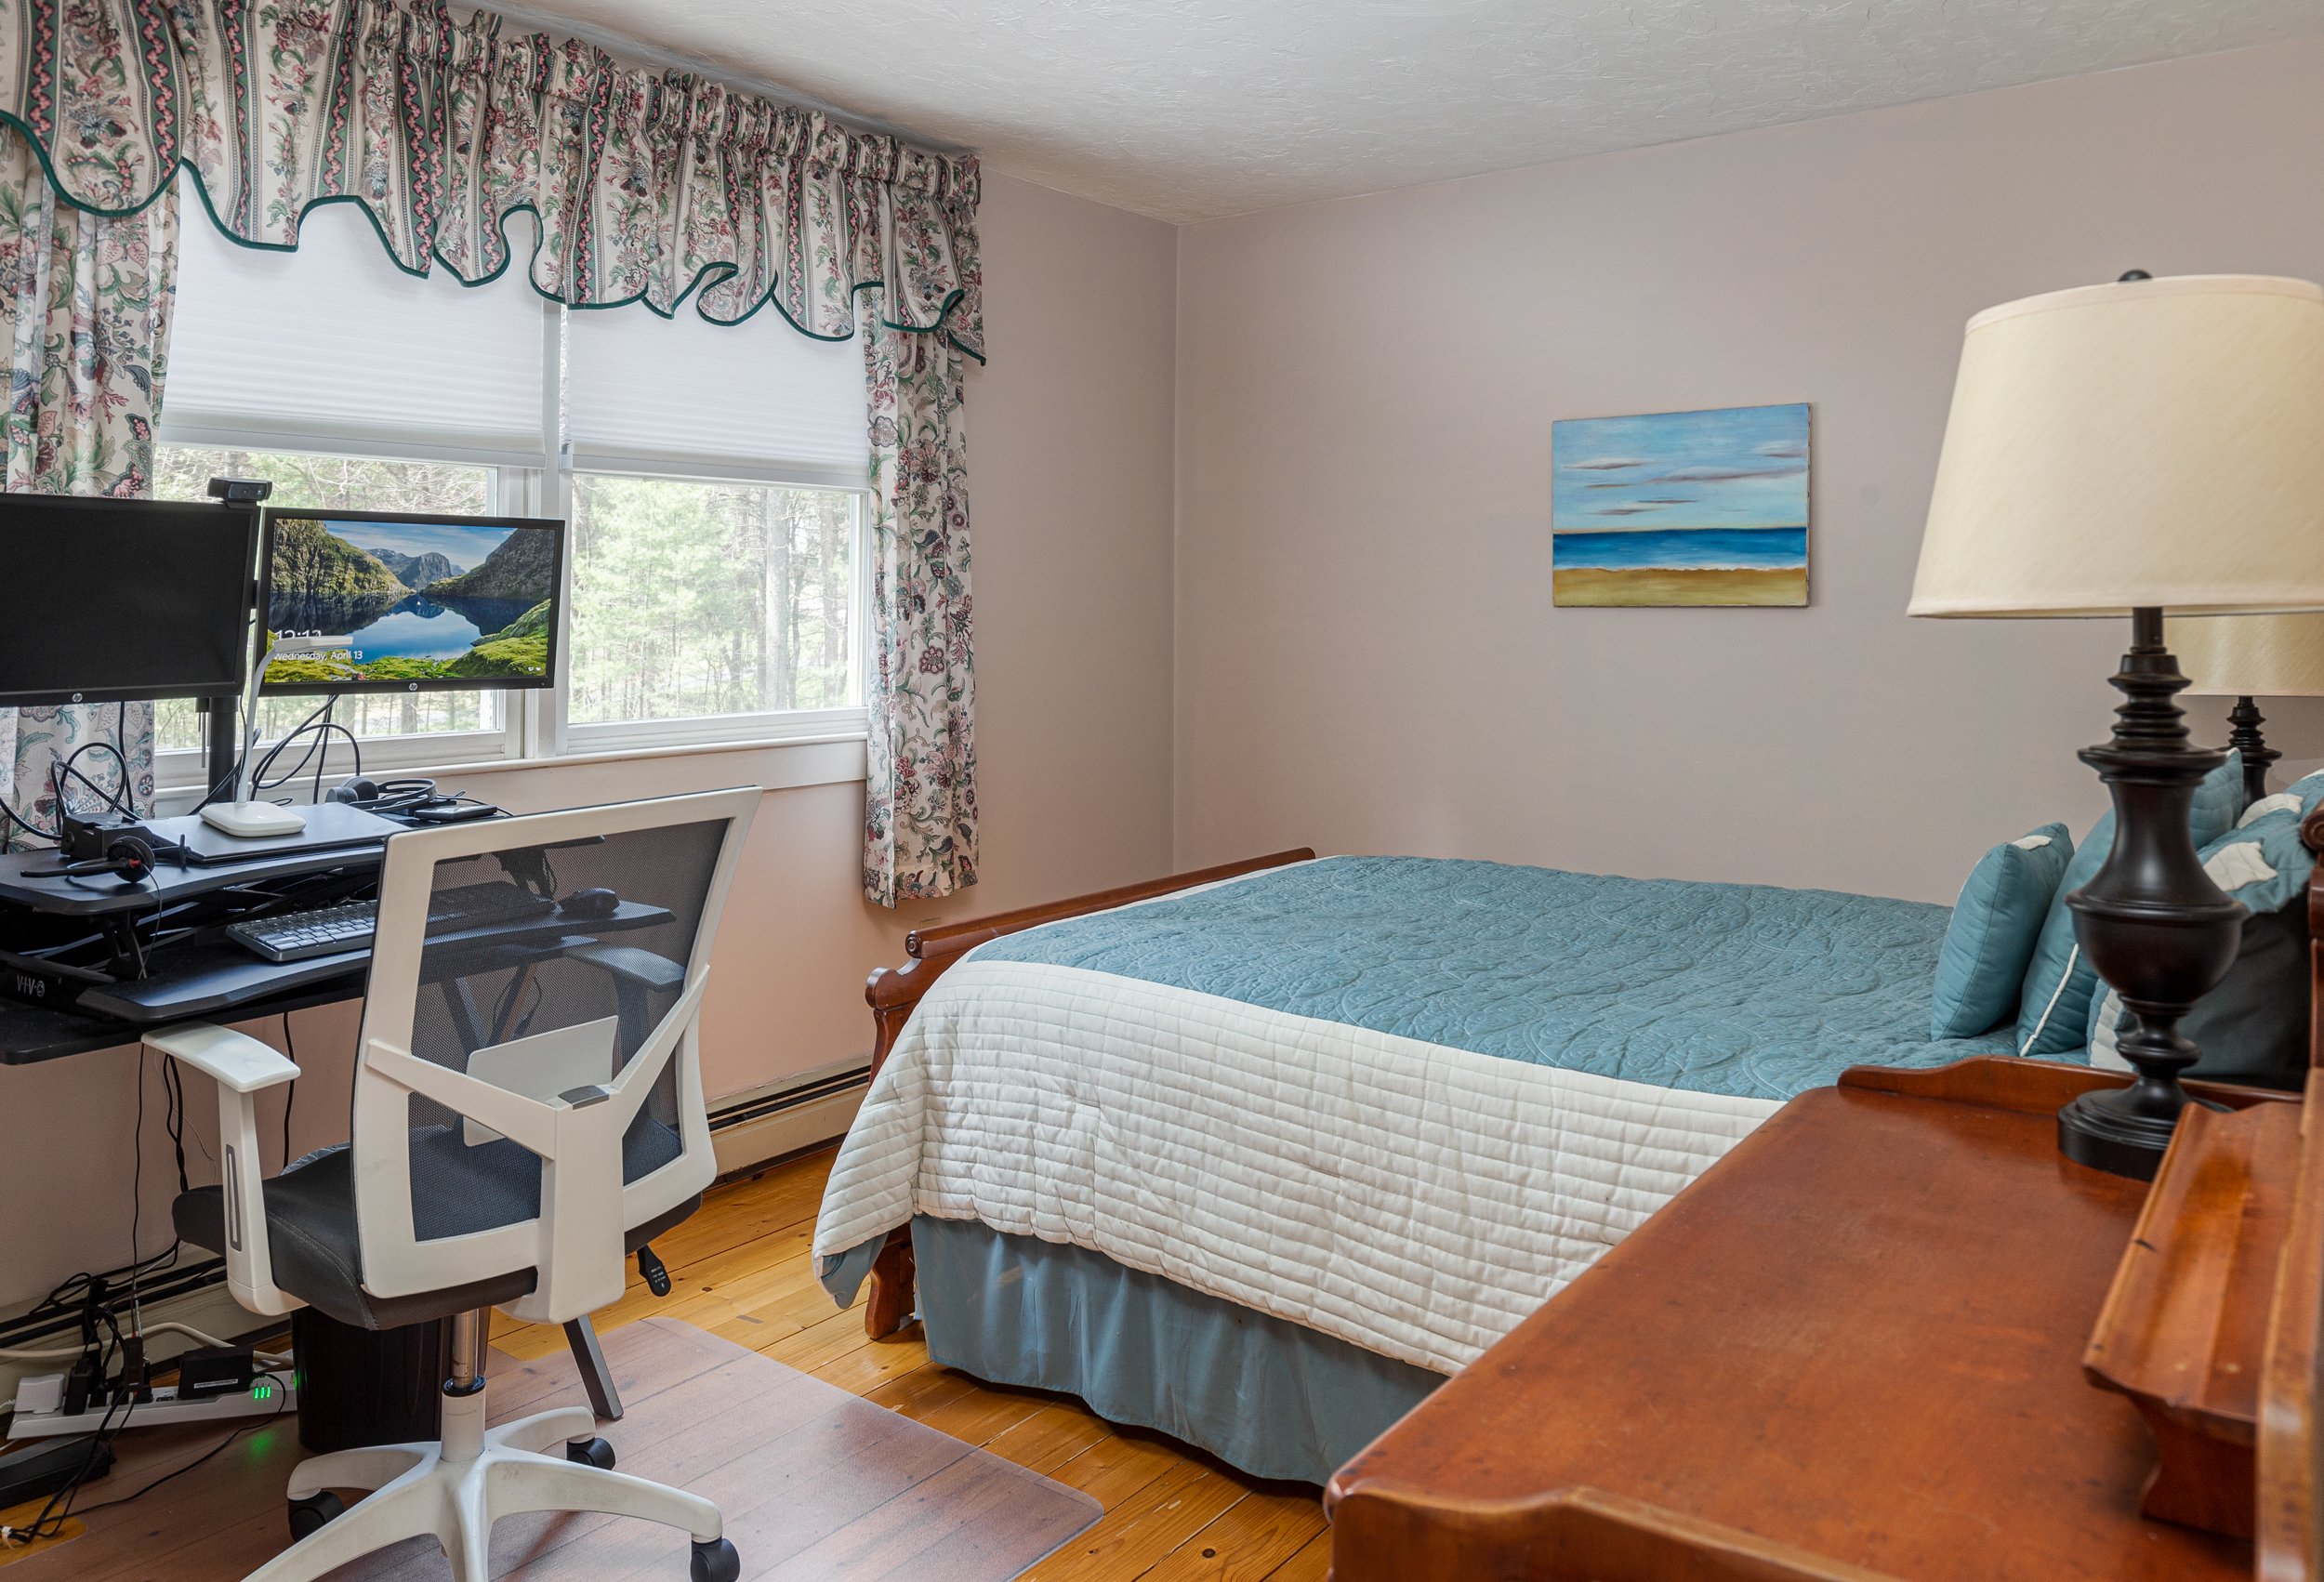
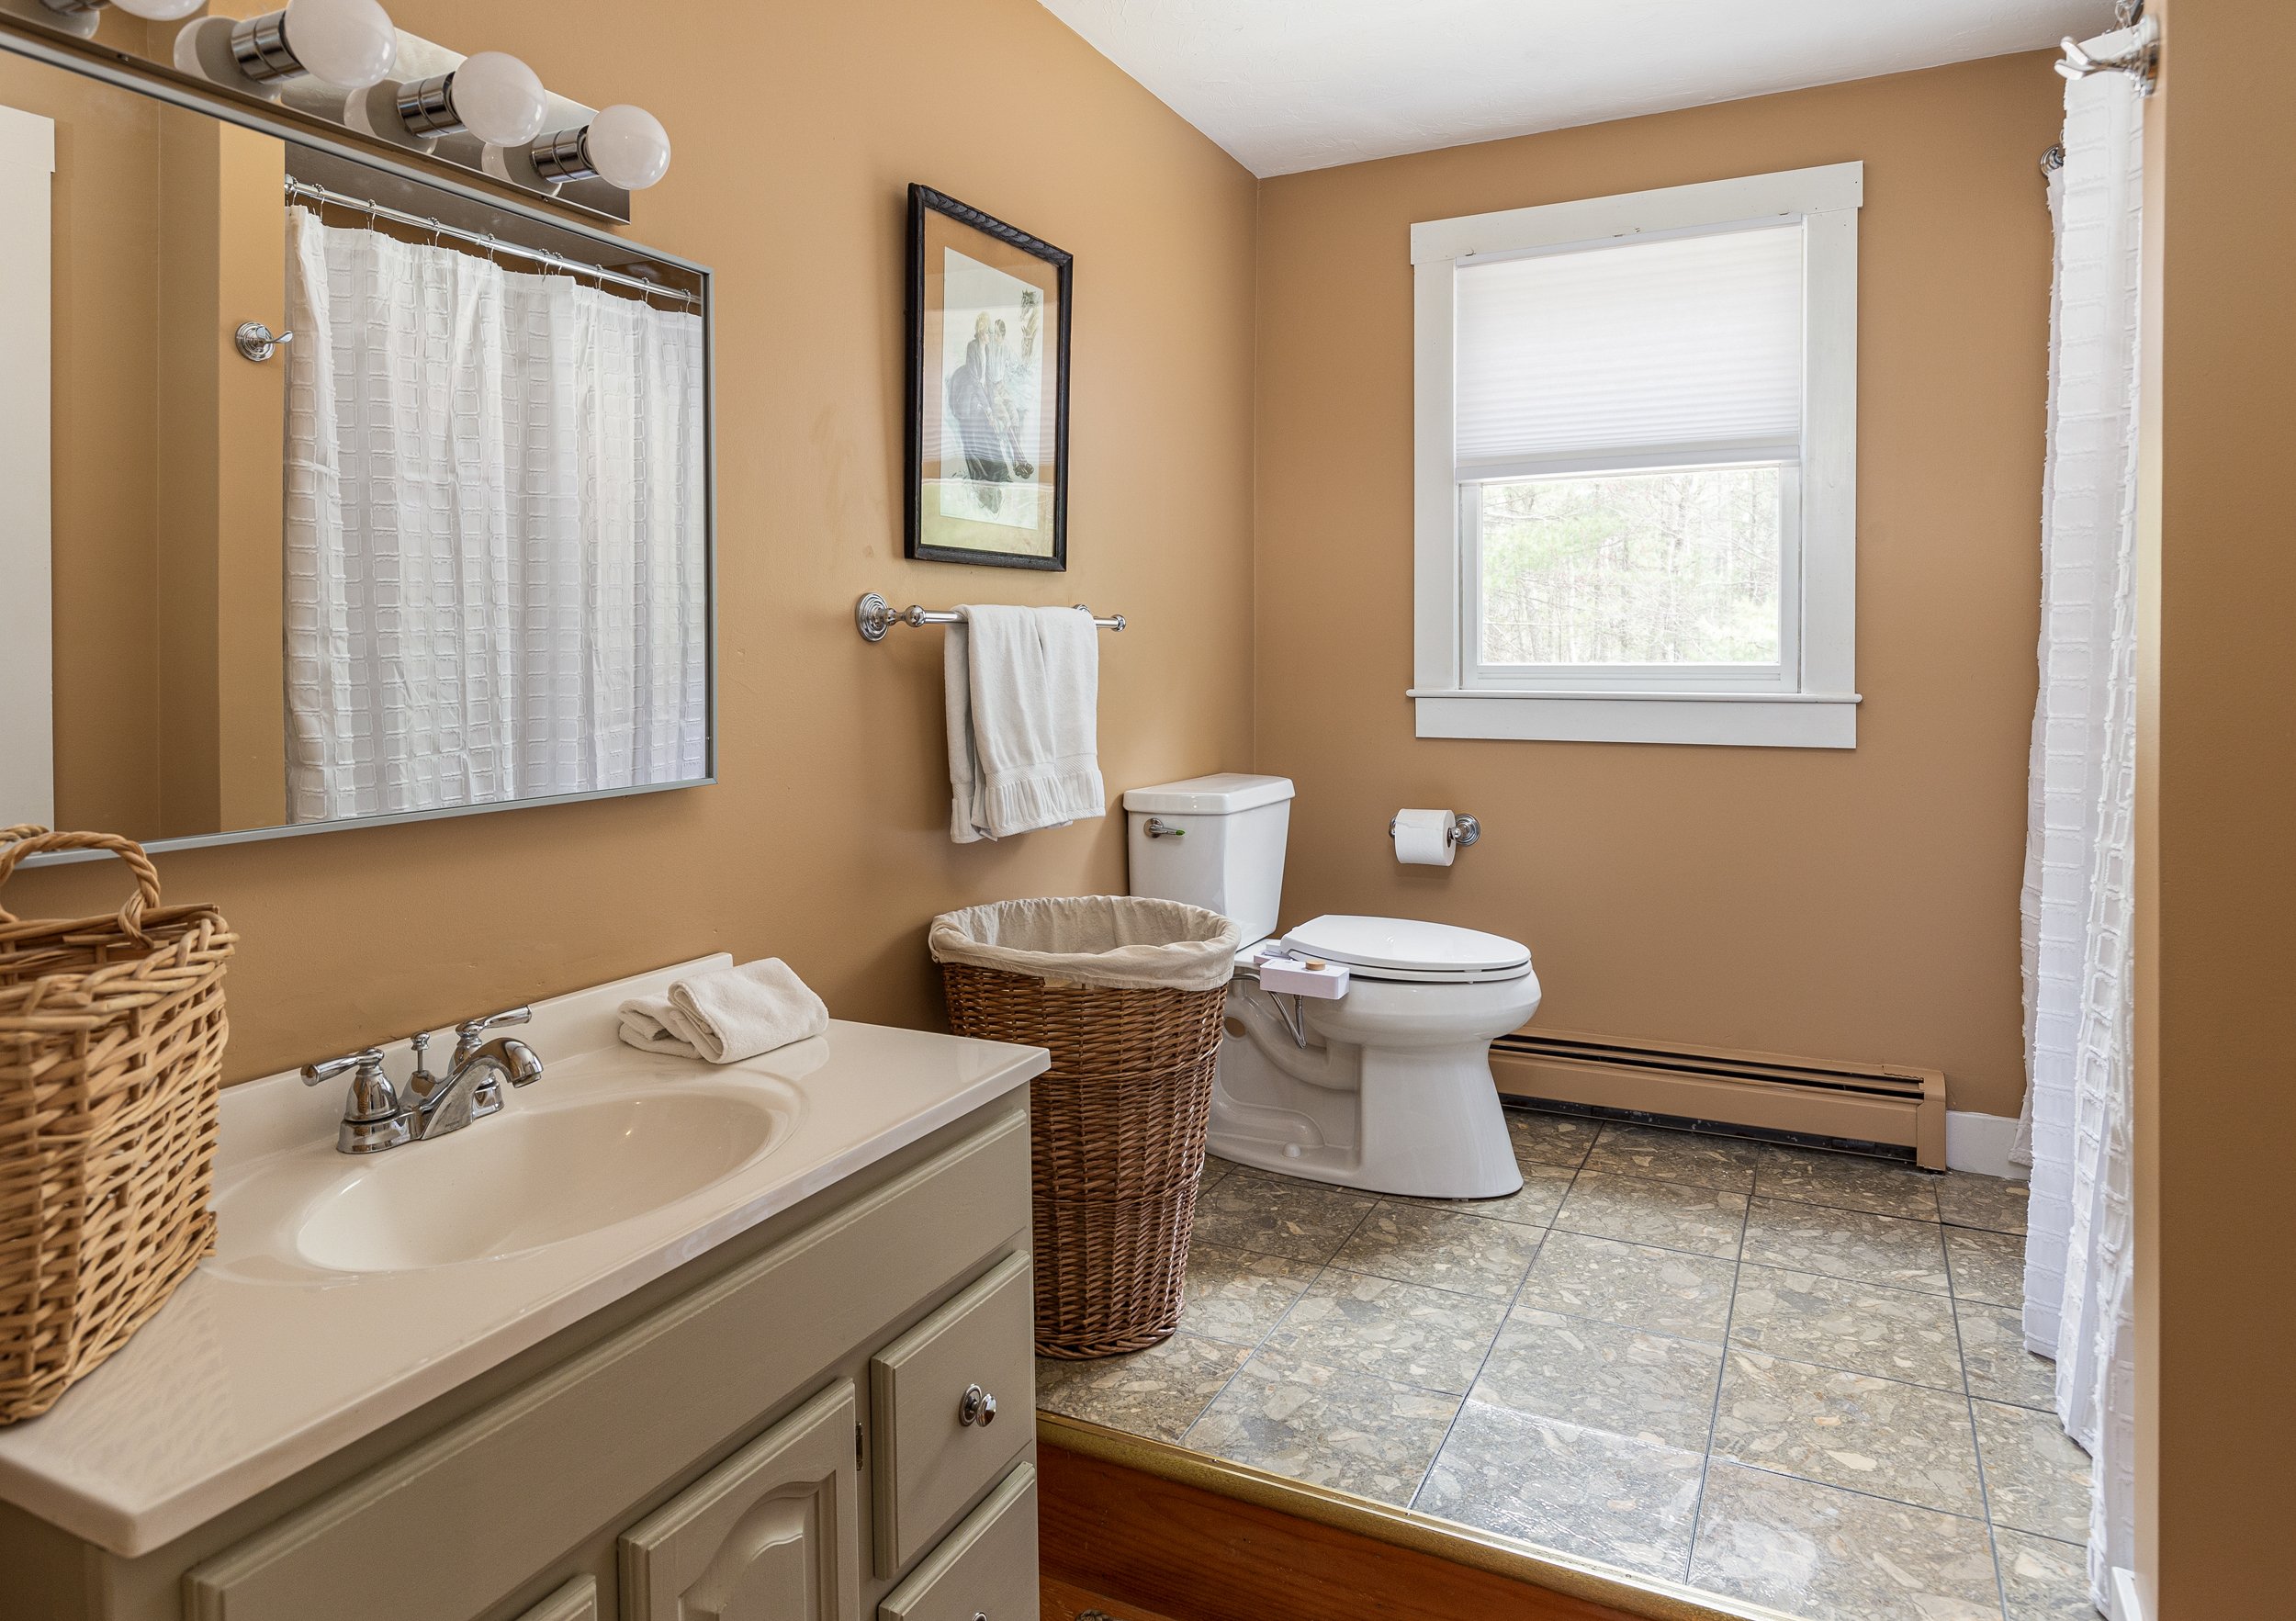
Let this turnkey gem become your haven of relaxation, joy, and privacy. Step inside to discover an open layout that maximizes every square inch, offering you the perfect balance of style and functionality. The open-concept layout seamlessly connects the living, dining, and kitchen areas, and the pristine kitchen is outfitted with an abundance of storage space for all your culinary essentials. In addition to the main living area, the lower level offers a flex space and features a cozy family room with a gas fireplace. Outside, the beauty continues as you step into your professionally landscaped backyard with privacy landscaping on all sides. A spacious deck beckons you to unwind and is the perfect spot for summer barbecues, al fresco dining, or simply sipping your morning coffee. Nestled in a highly desirable neighborhood, you'll enjoy easy access to schools, parks, shopping centers, and major transportation routes. Come and experience the true meaning of a move-in-ready home.
Request More Info or Book a Tour
IMPROVEMENTS
All landscaping pruned, property edged, and fresh mulch - 2023
New stove, fridge, and microwave - Frigidaire - 2022
Ducts cleaned, HVAC serviced - 2021
Irrigation system - 2018
Exterior stone walls and lighted landscaping - 2016
New tankless water heater - Stiebel Eltron - 2016
New 30 year architectural roof - 2016
14’ x 15’ Trex Transcend deck - 2015
10’ x 12’ exterior shed with electricity - 2015
Exterior Hardie Board fiber cement siding - 2015
HOME & PROPERTY INFO
Lot Size: 0.29 acres
Year Built: 1955
Total Rooms: 6
Basement: Full, partially finished
Parking: 1 car garage, 4 driveway
Heating: Heat pump, forced air
Cooling: Central air
Cooking: Gas
Water: Town
Sewer: Town
Estimated 2023 Taxes: $5,350
Request More Info or Book a Tour
Call Tracy at (508) 463-6481 or email us via the form below.
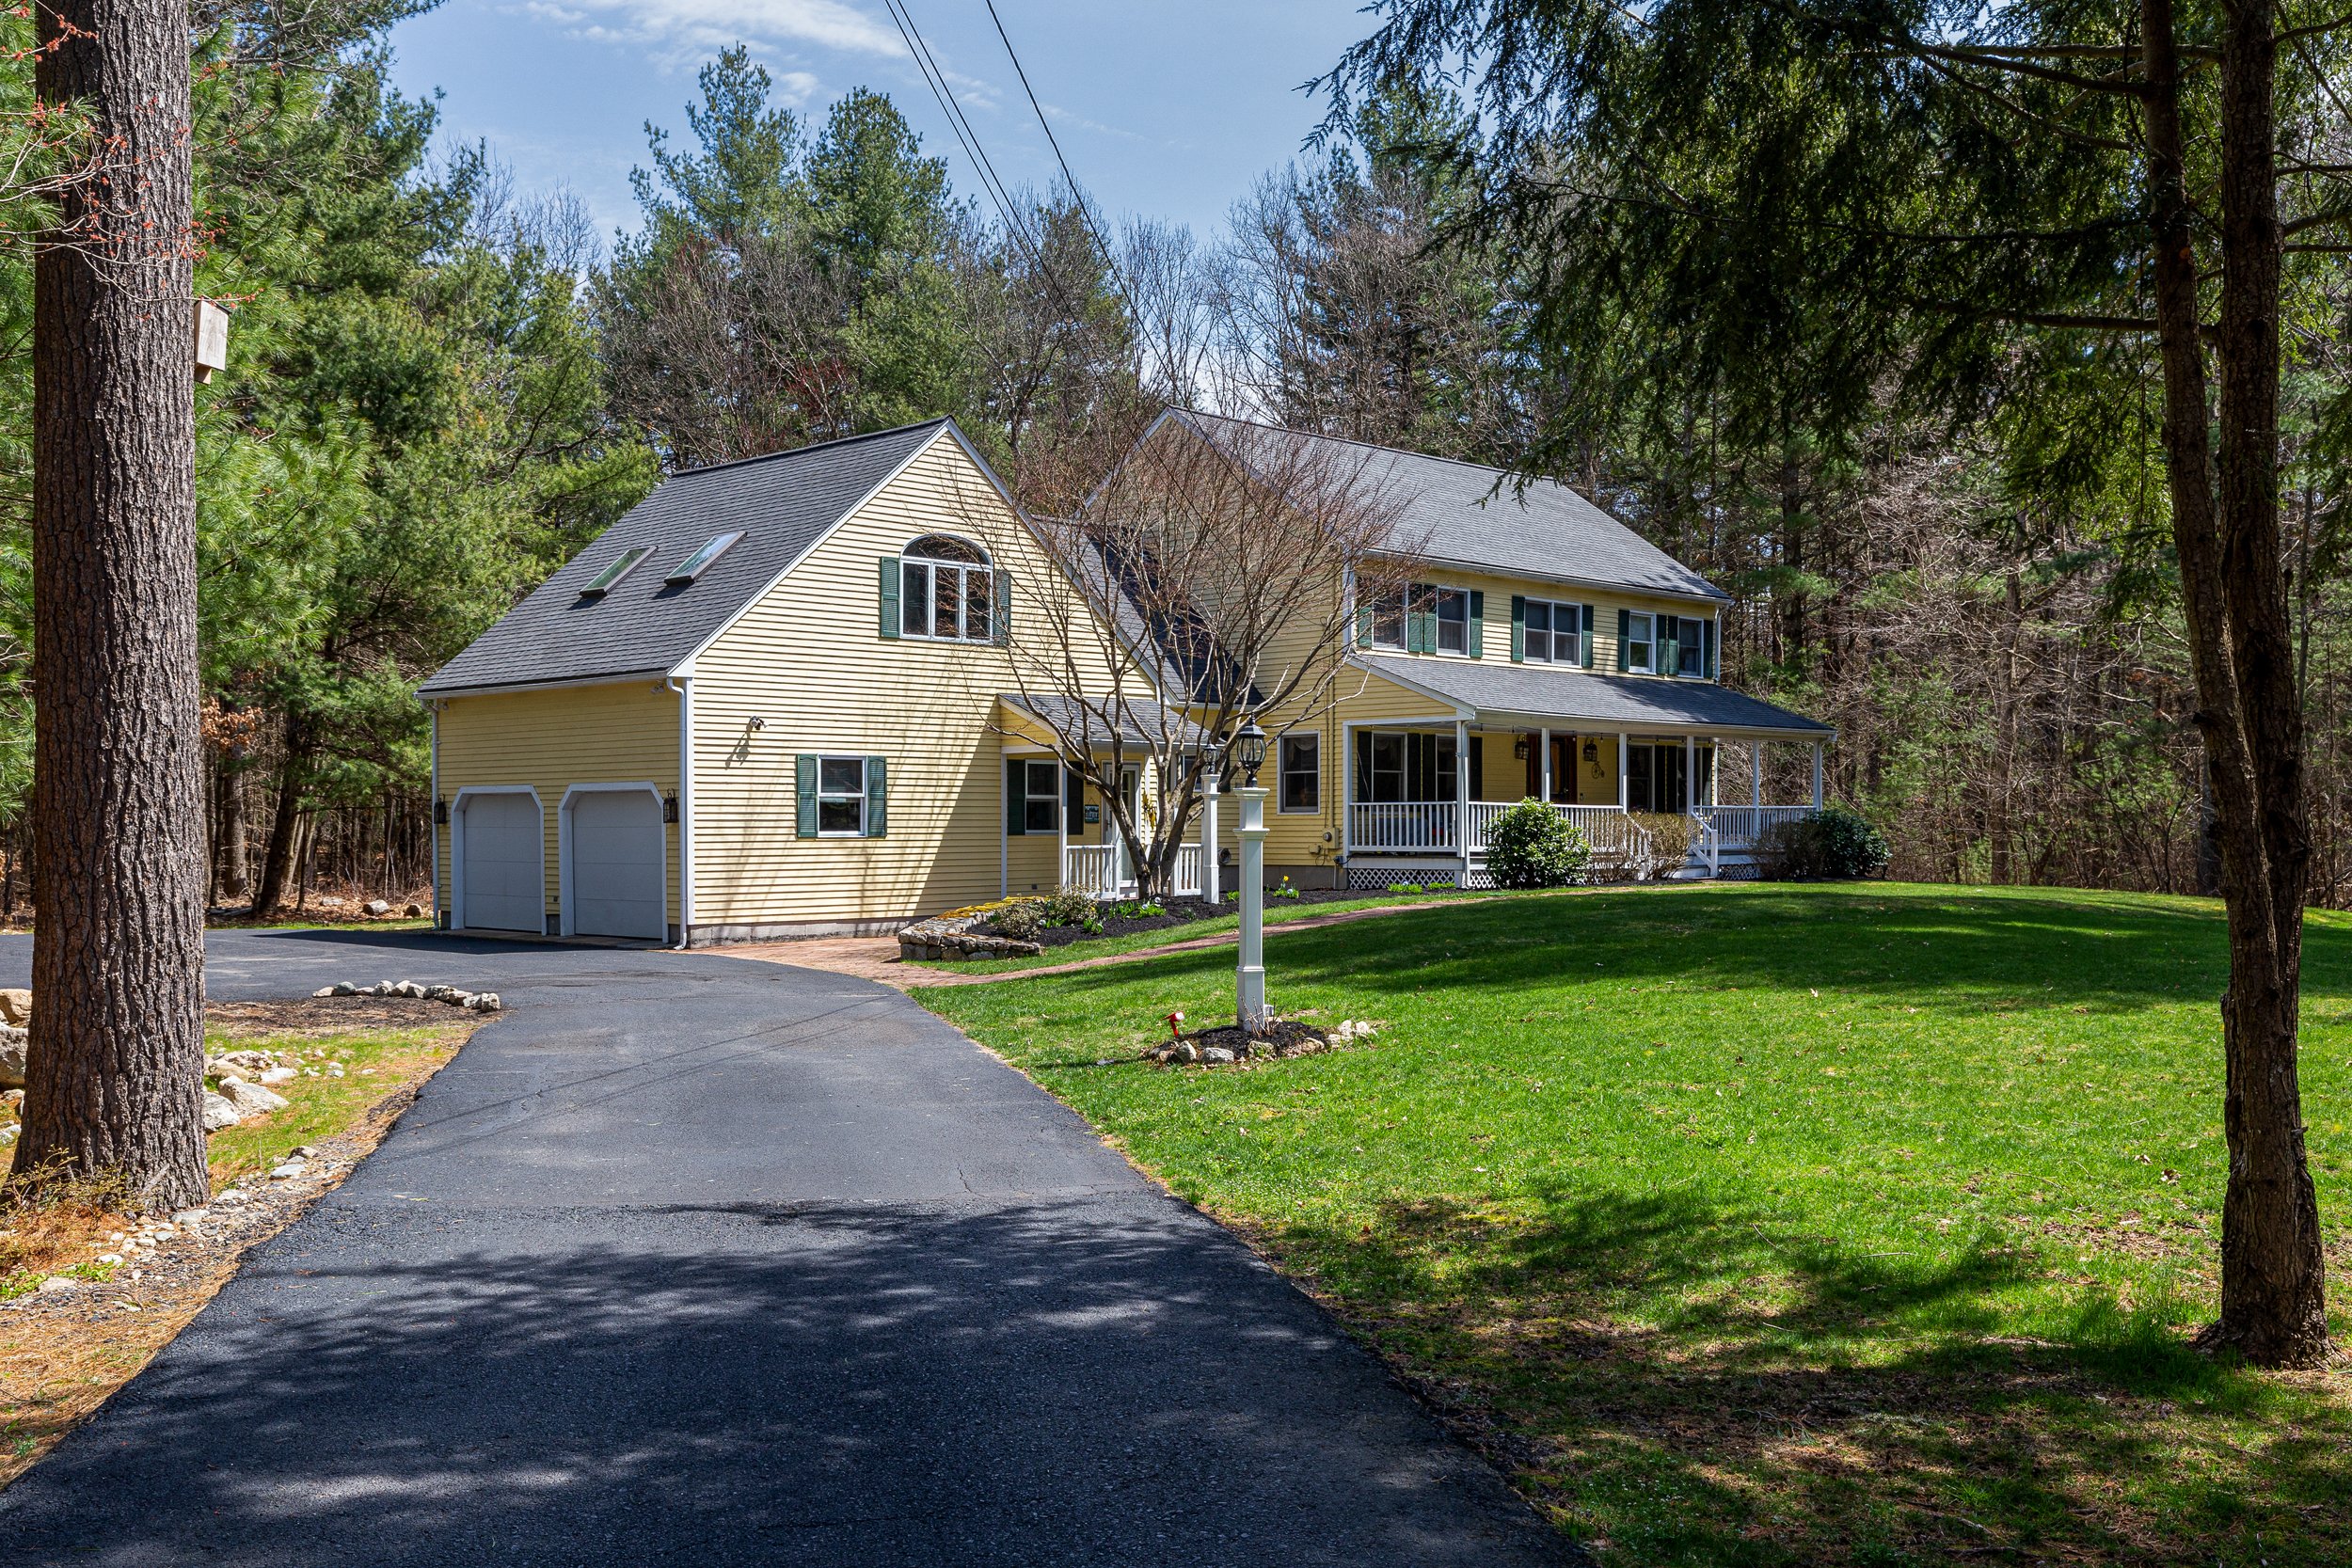
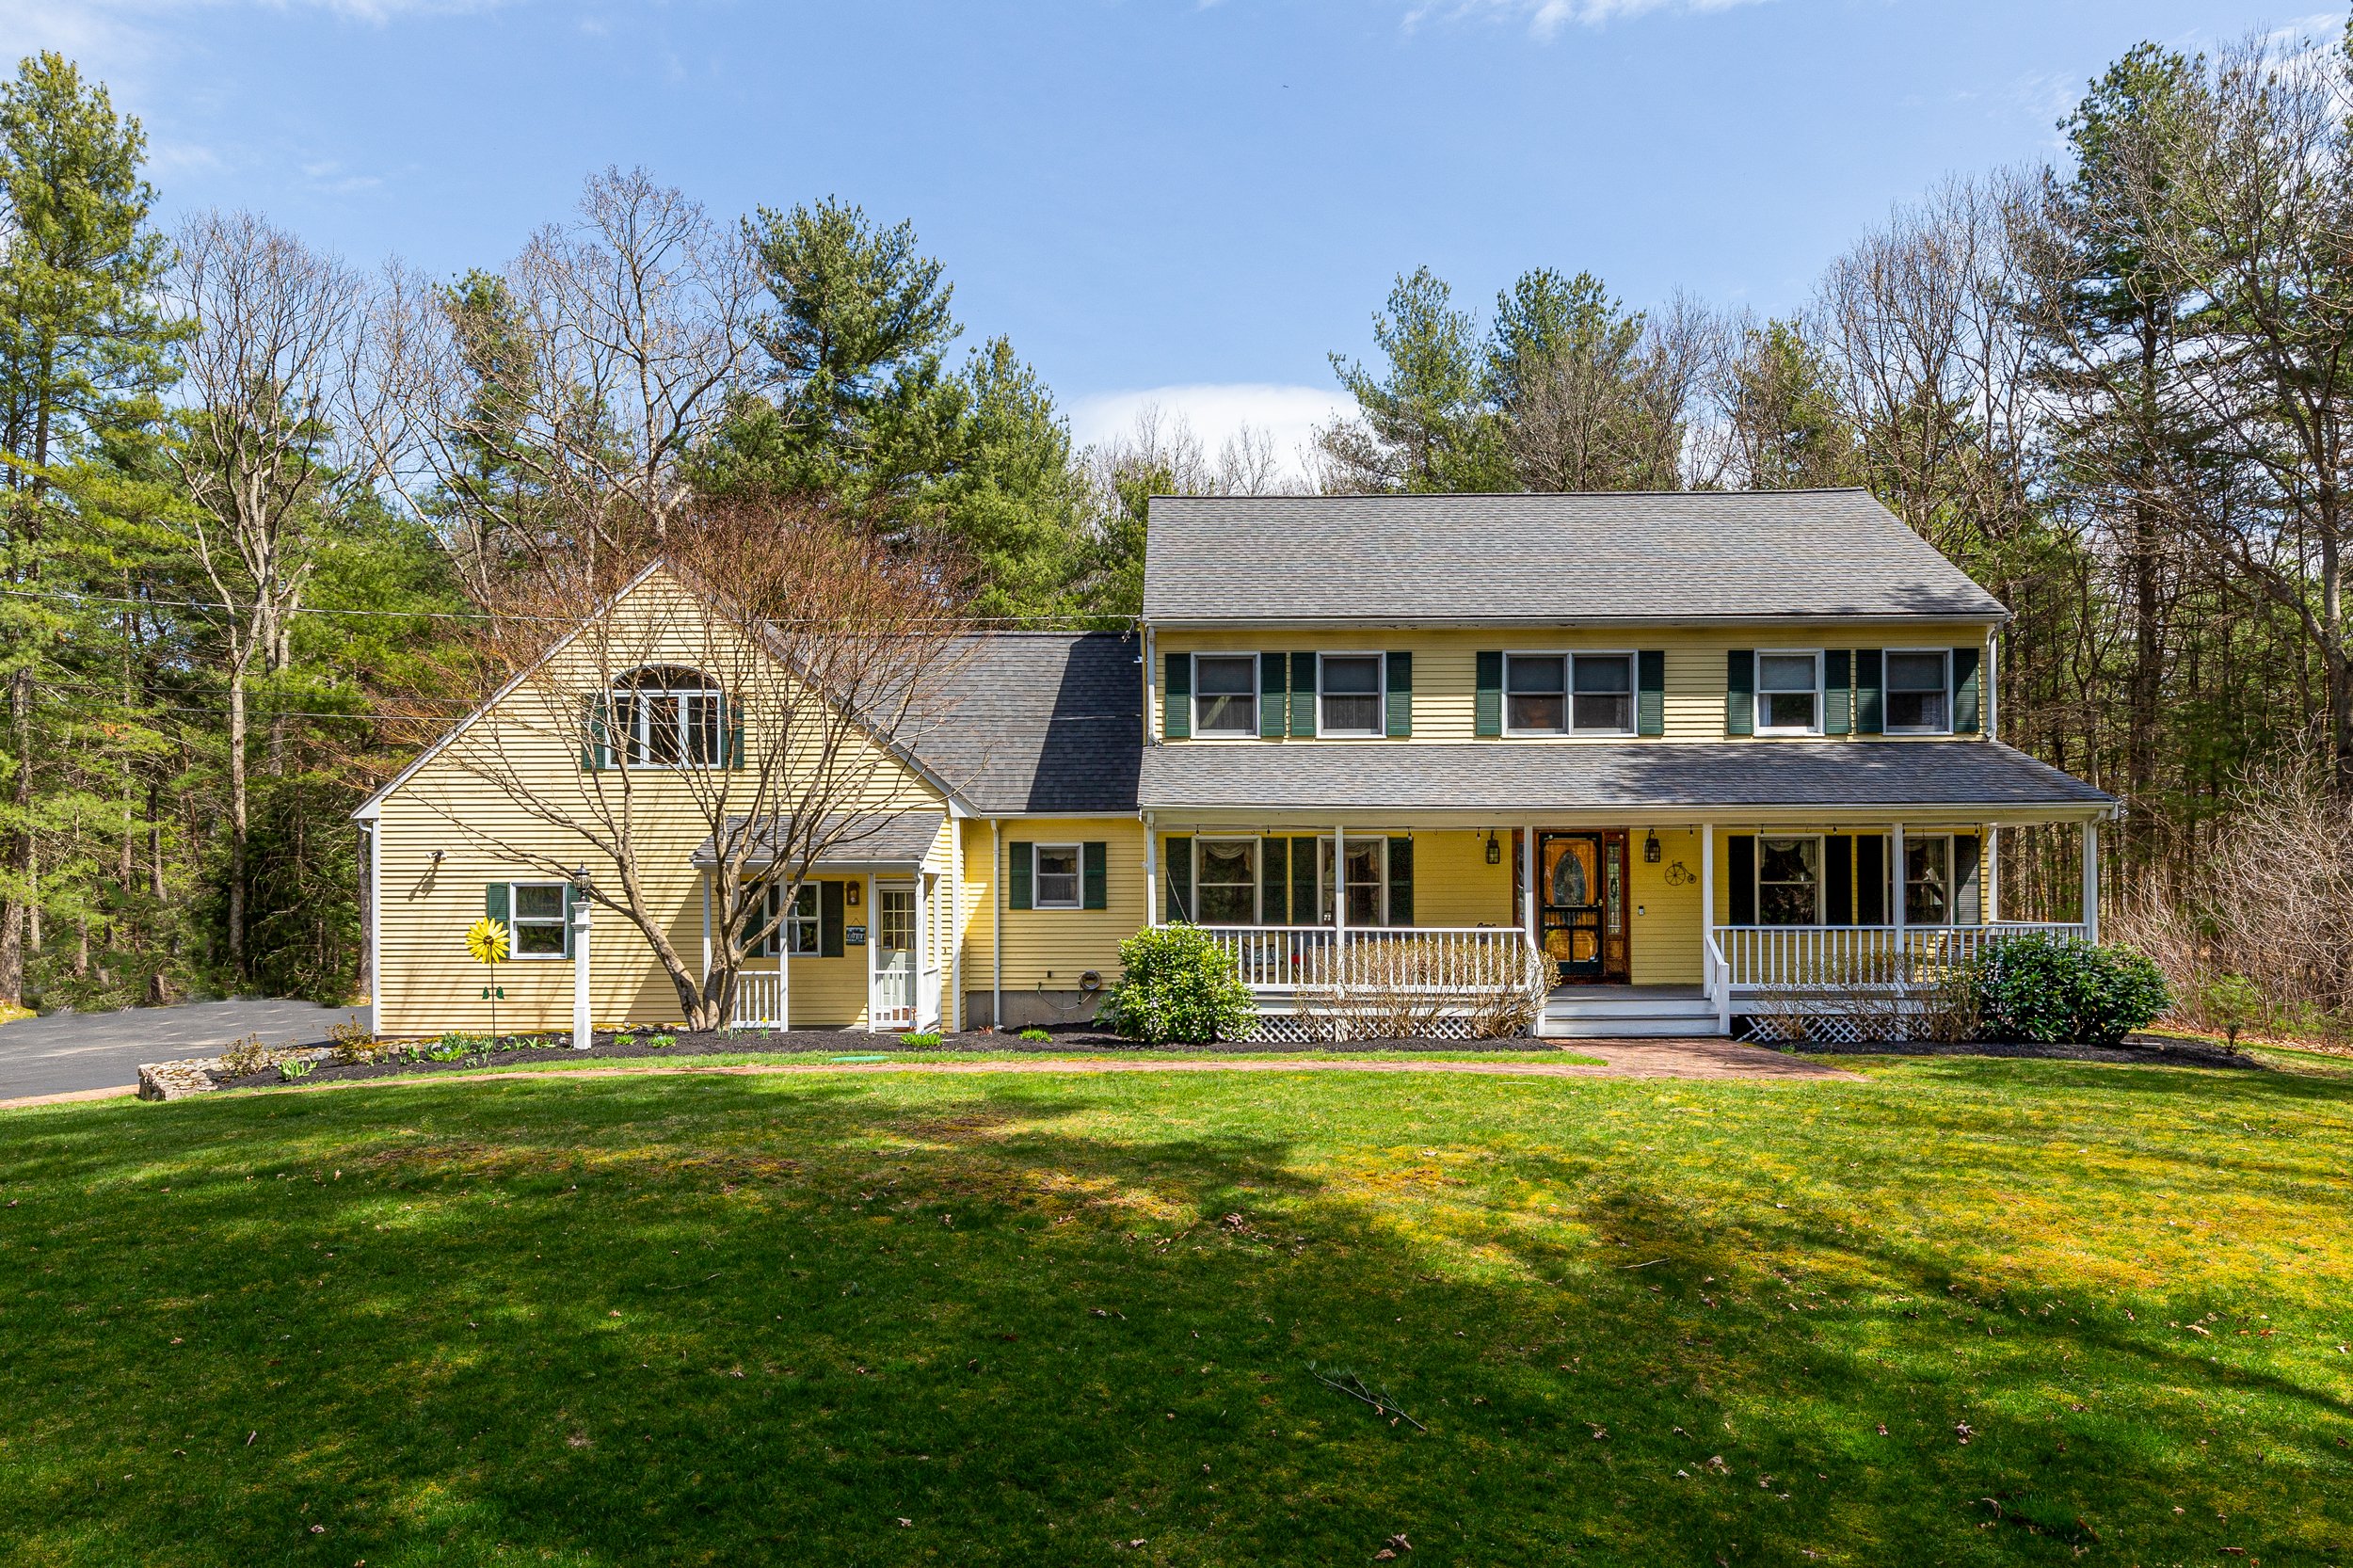
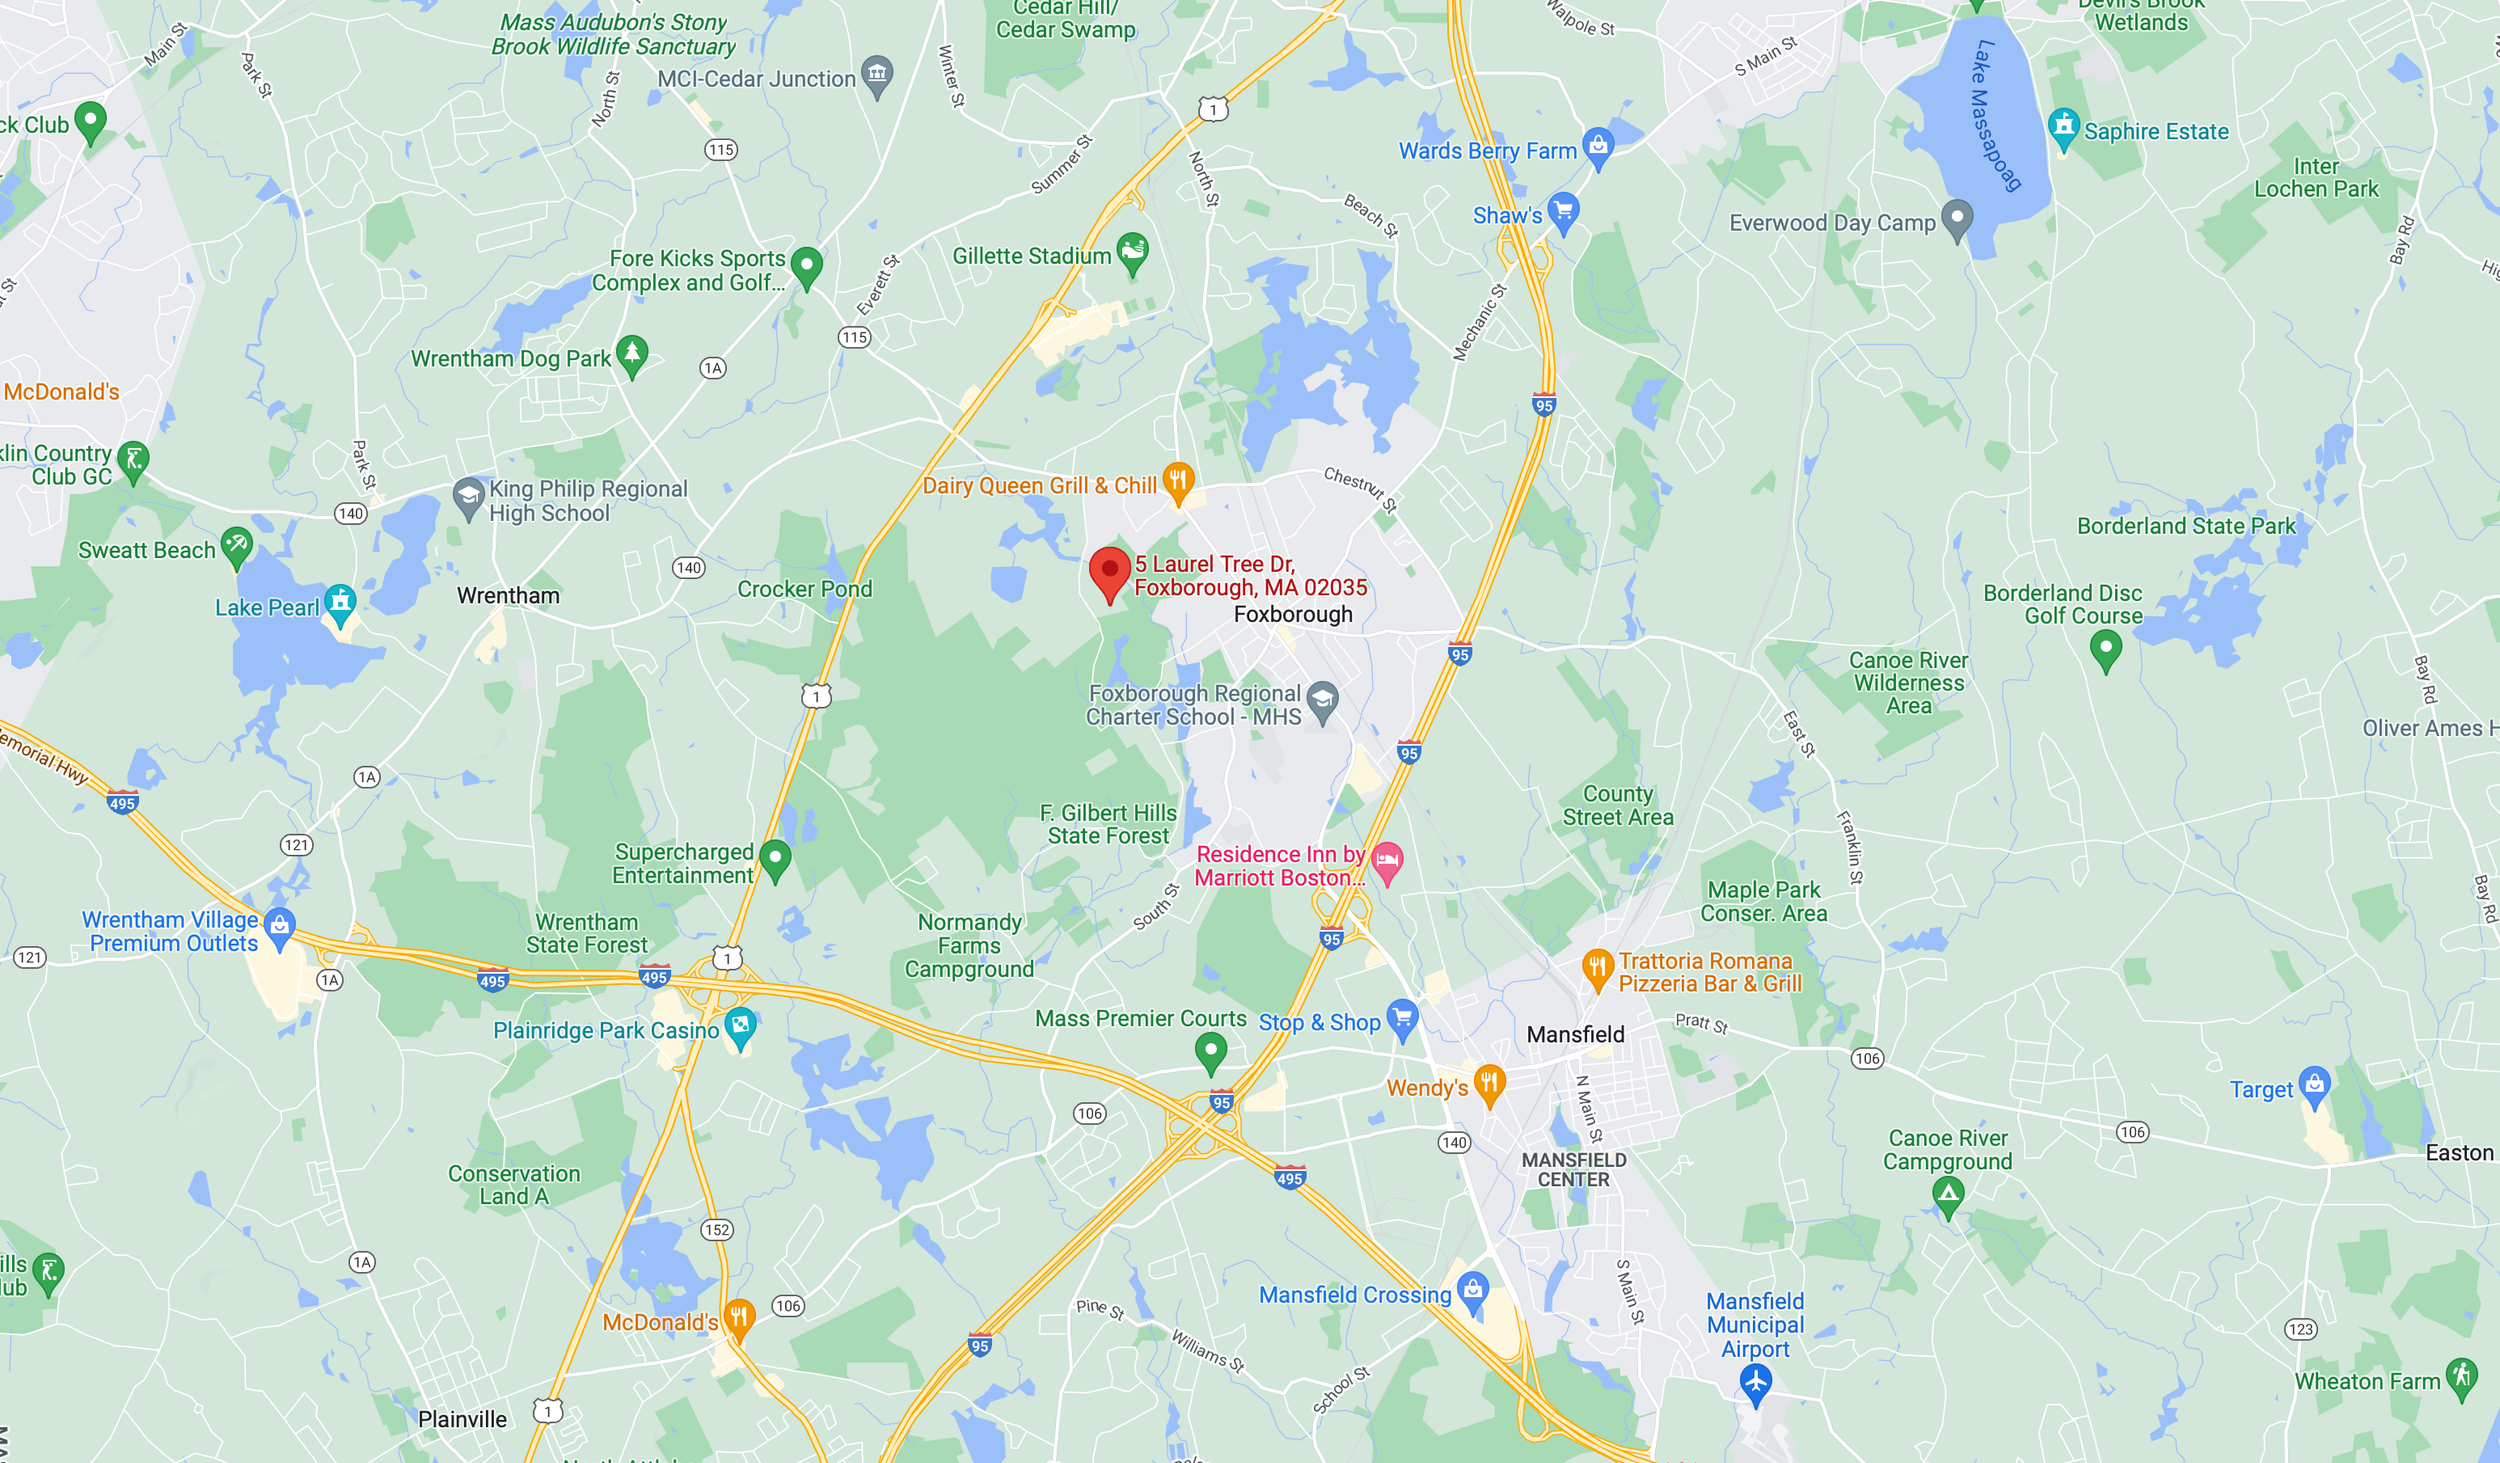
5 Laurel Tree Dr, Foxboro, MA 02035
SOLD
4 beds | 3 baths | 3,344 sq.ft. | 3.51 acres
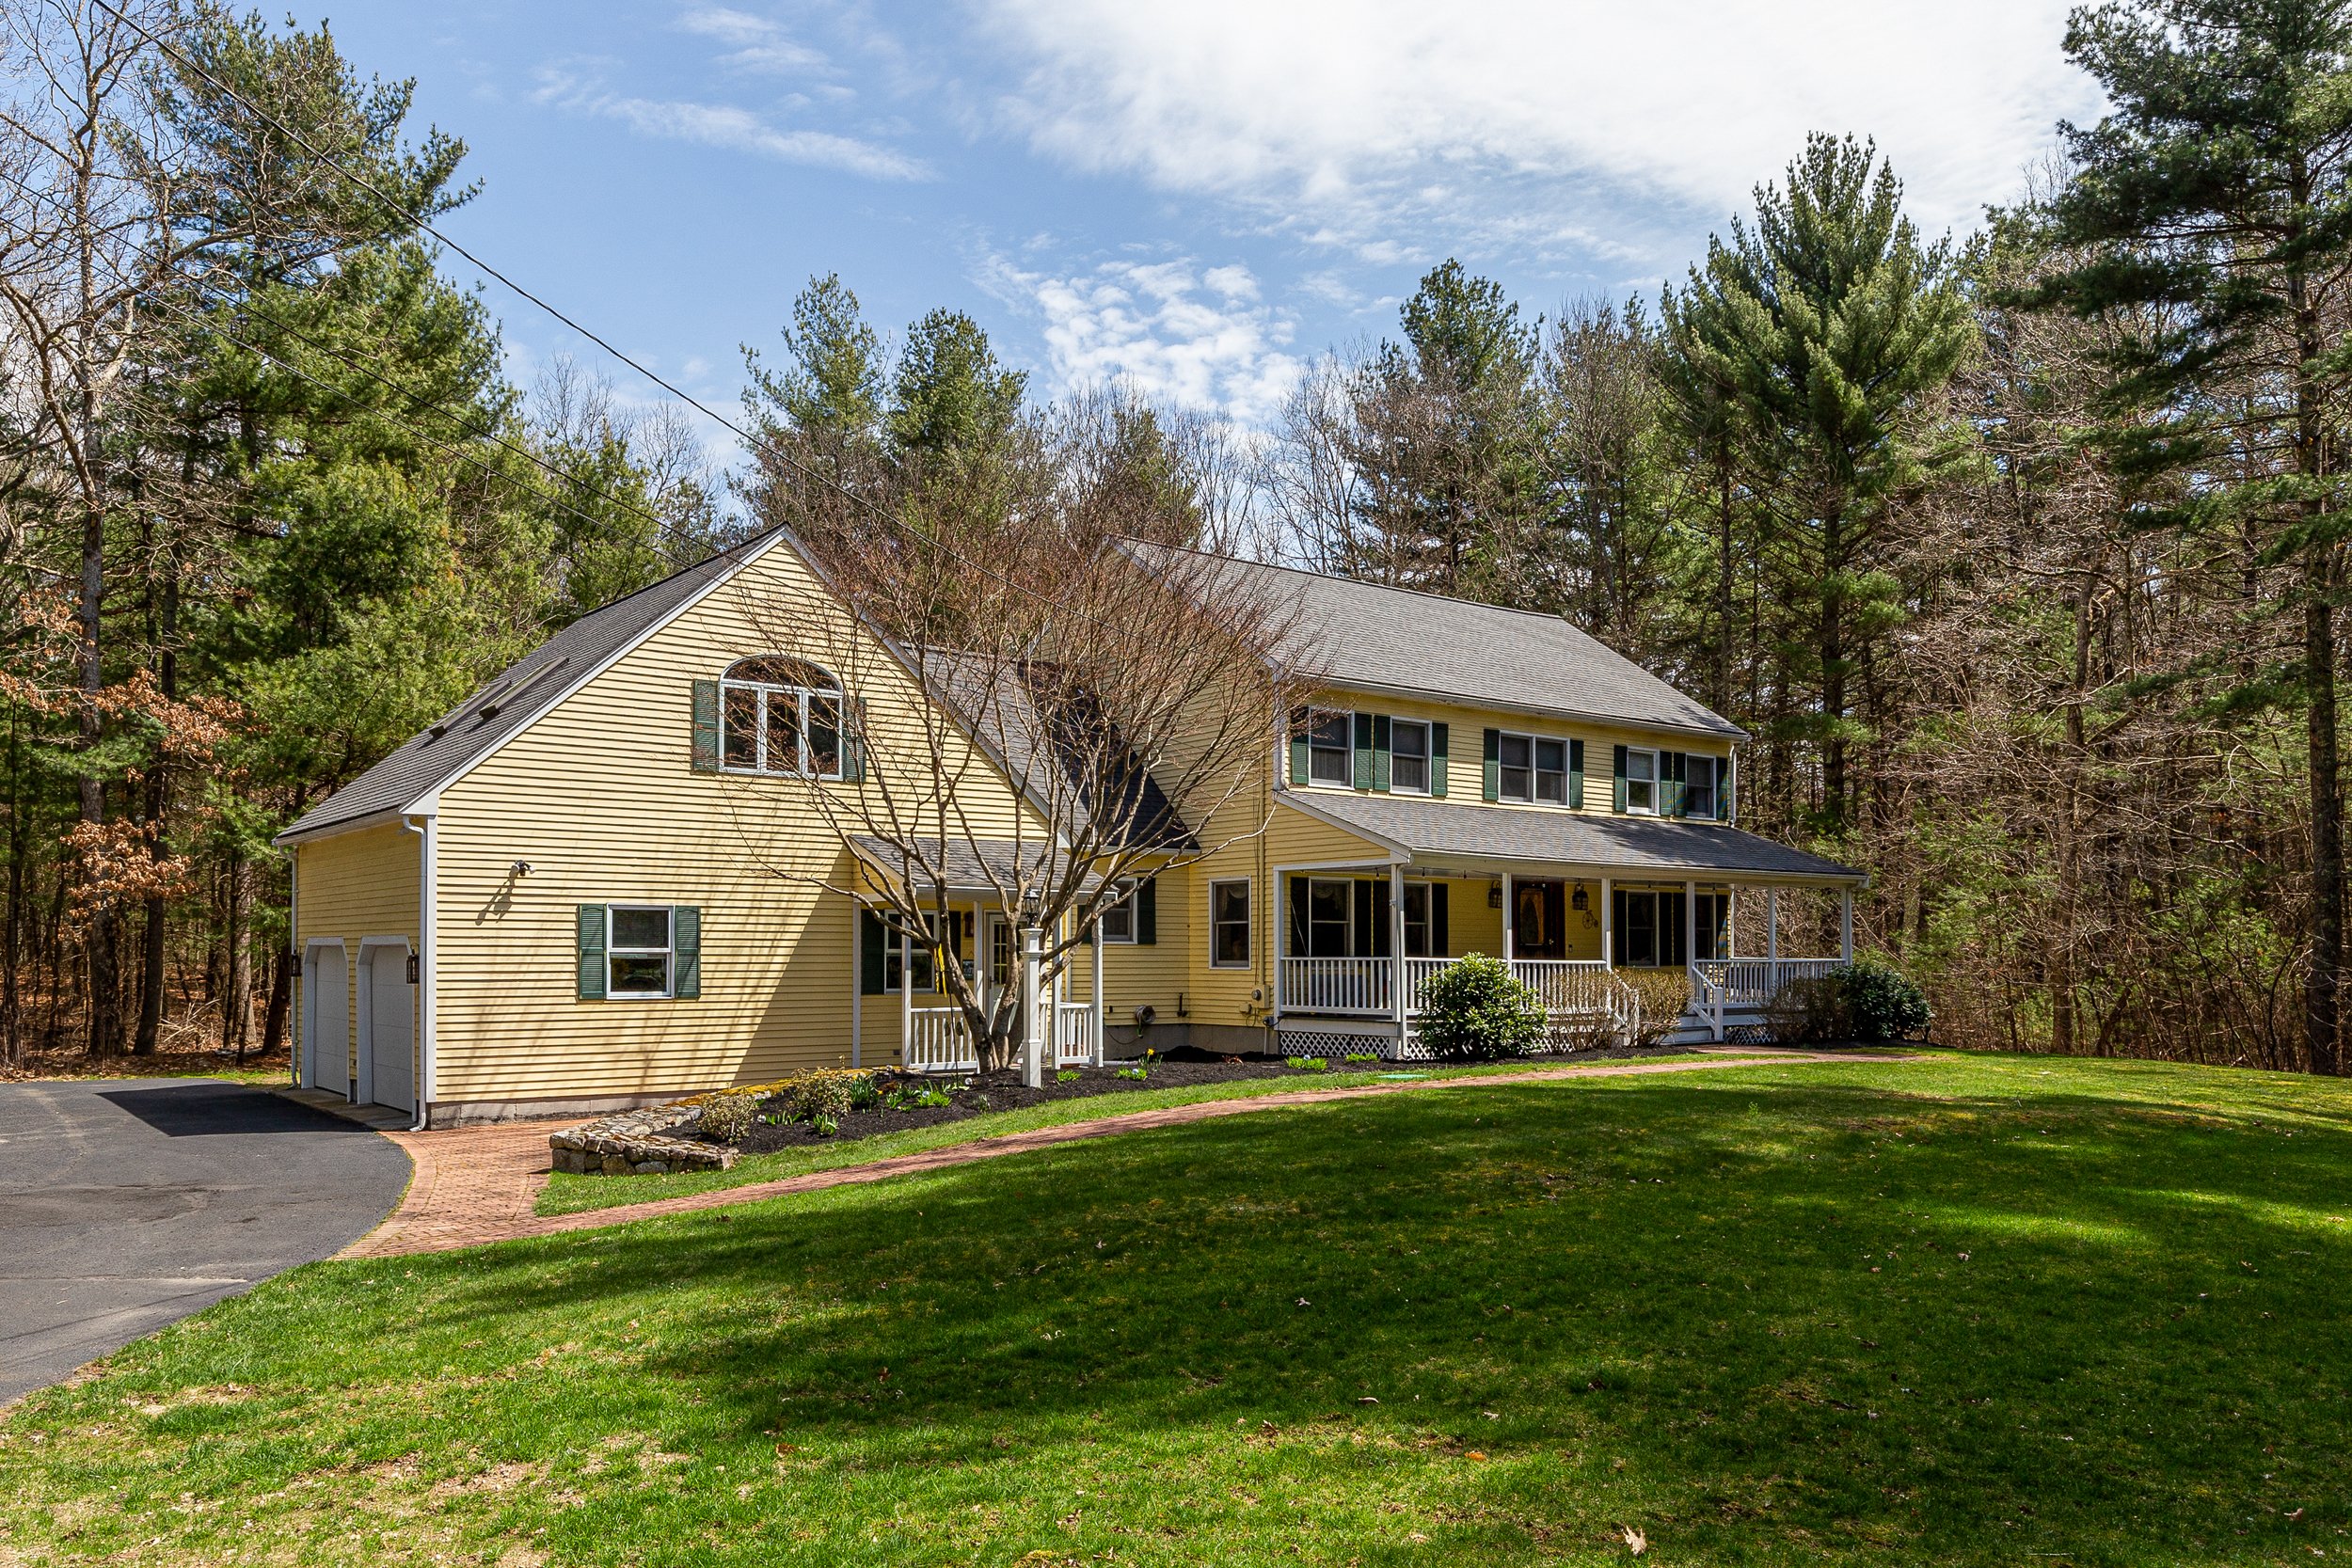
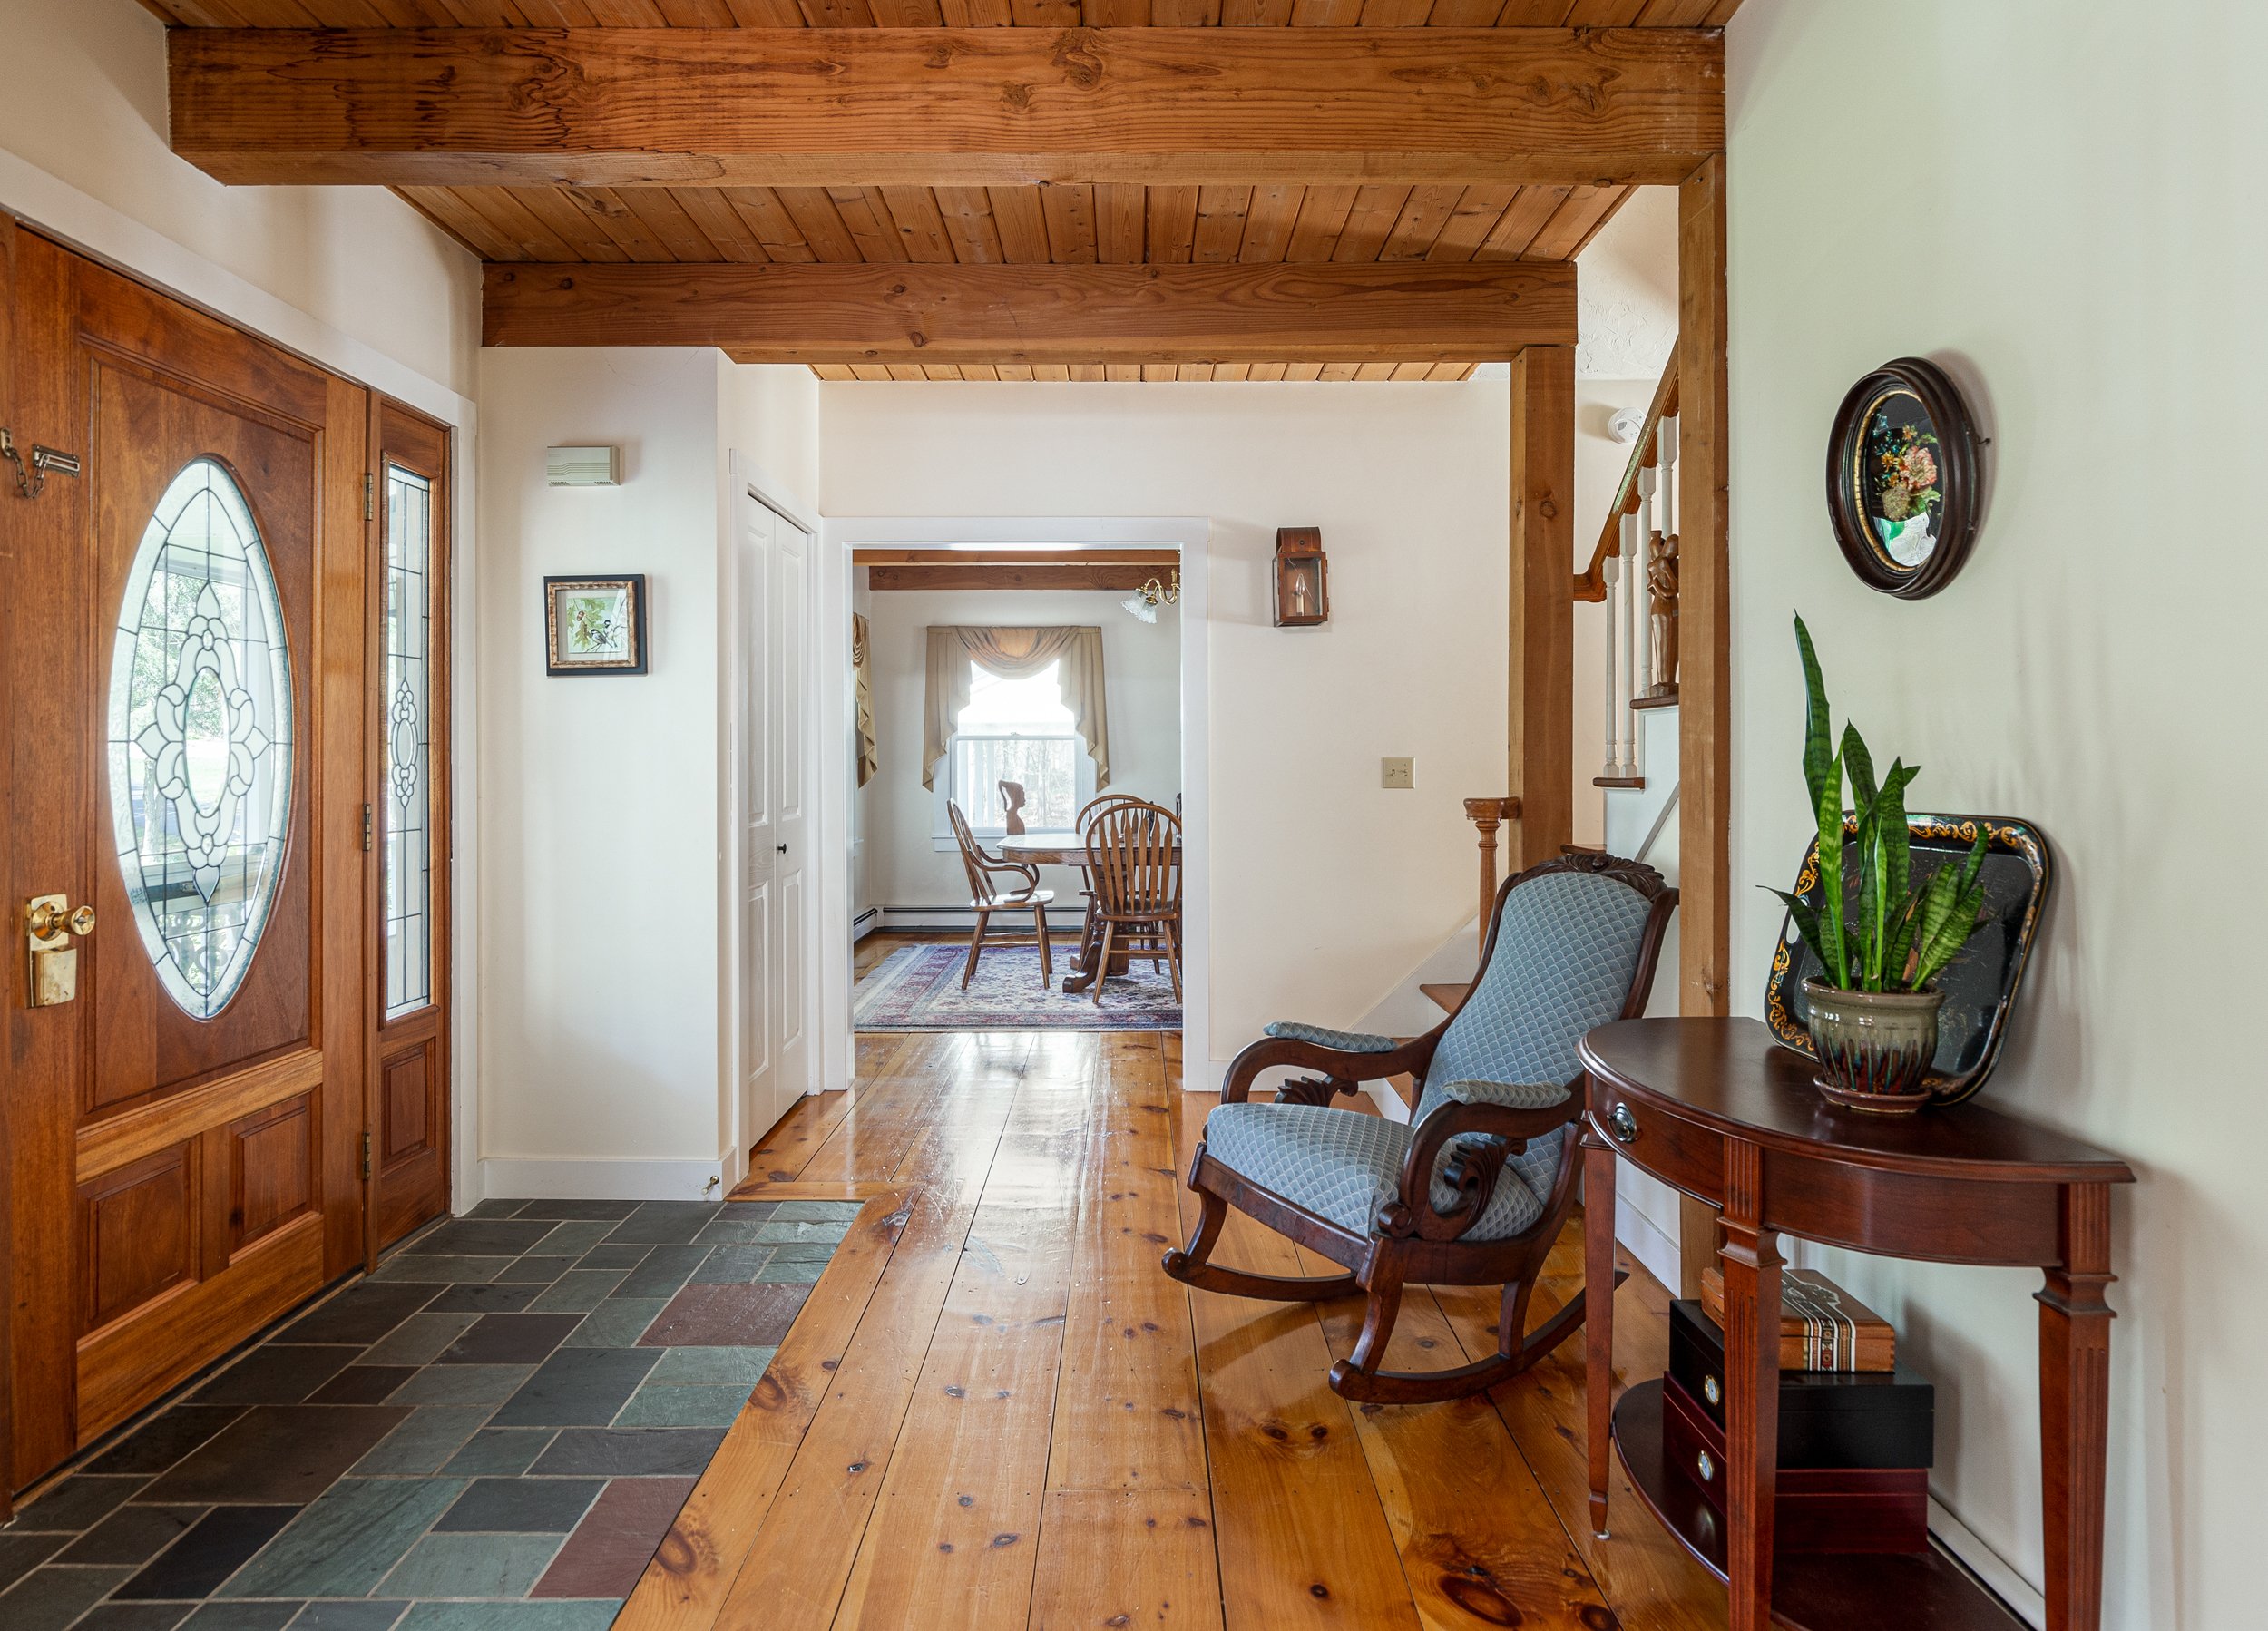
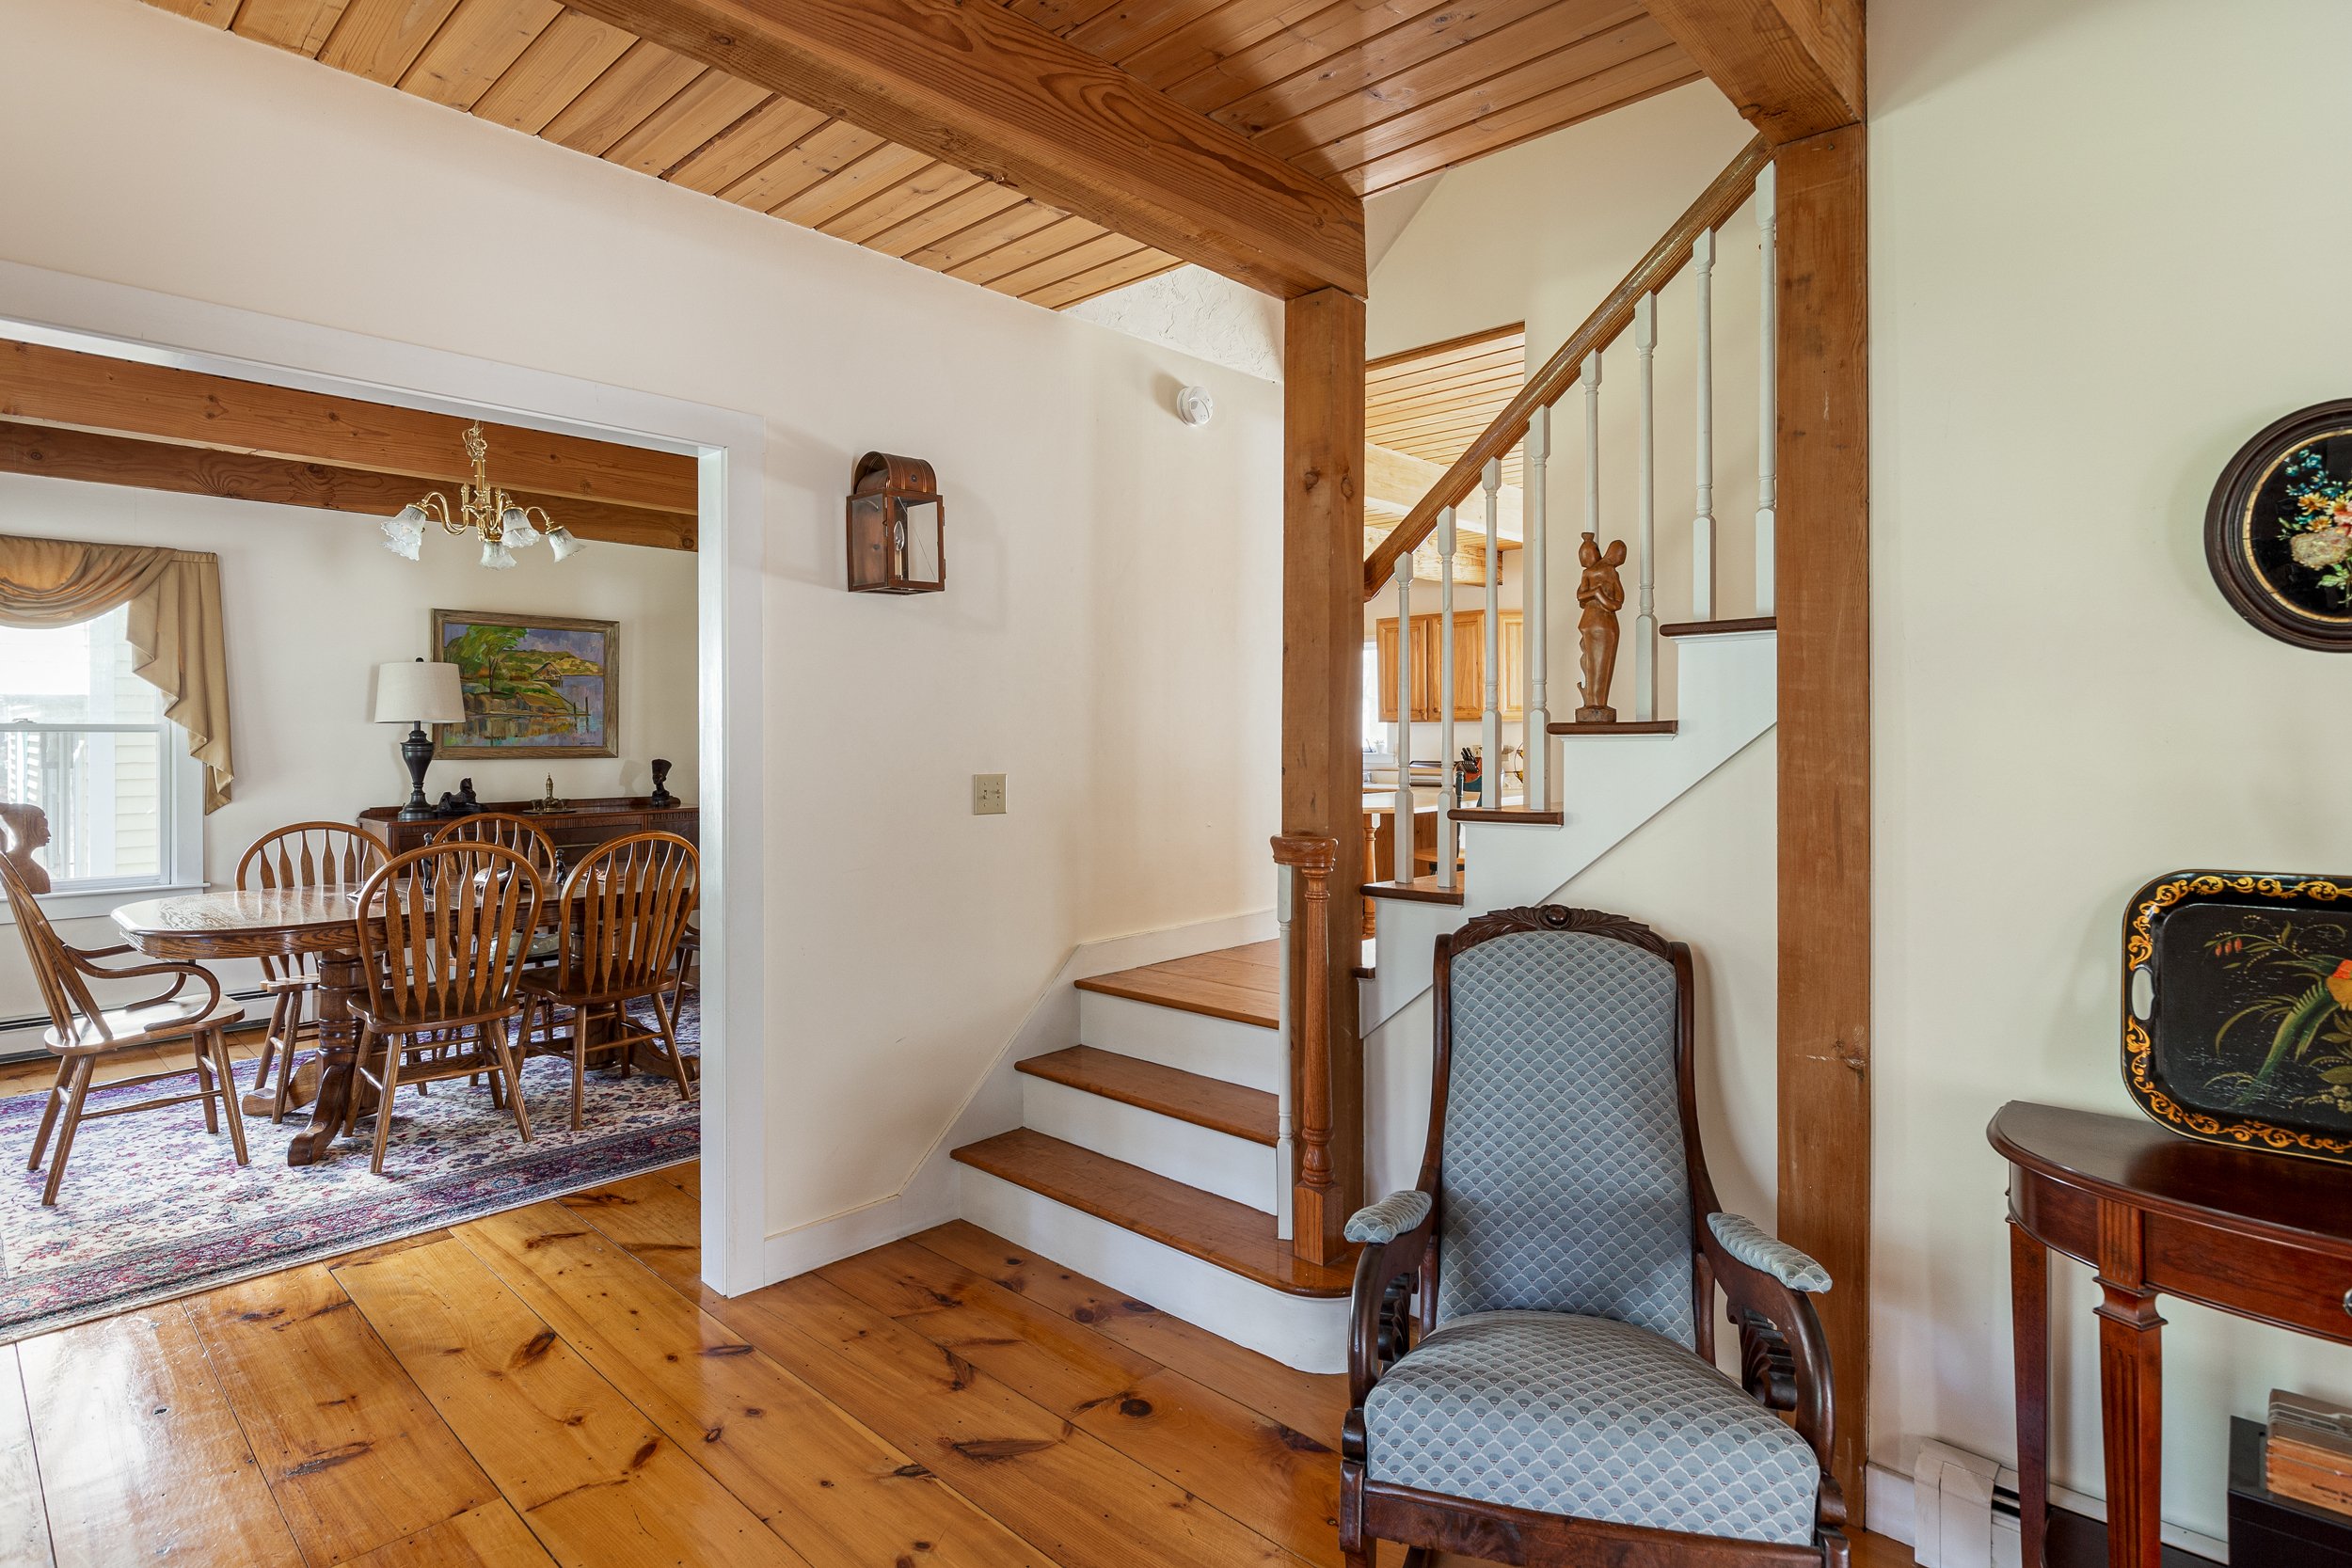
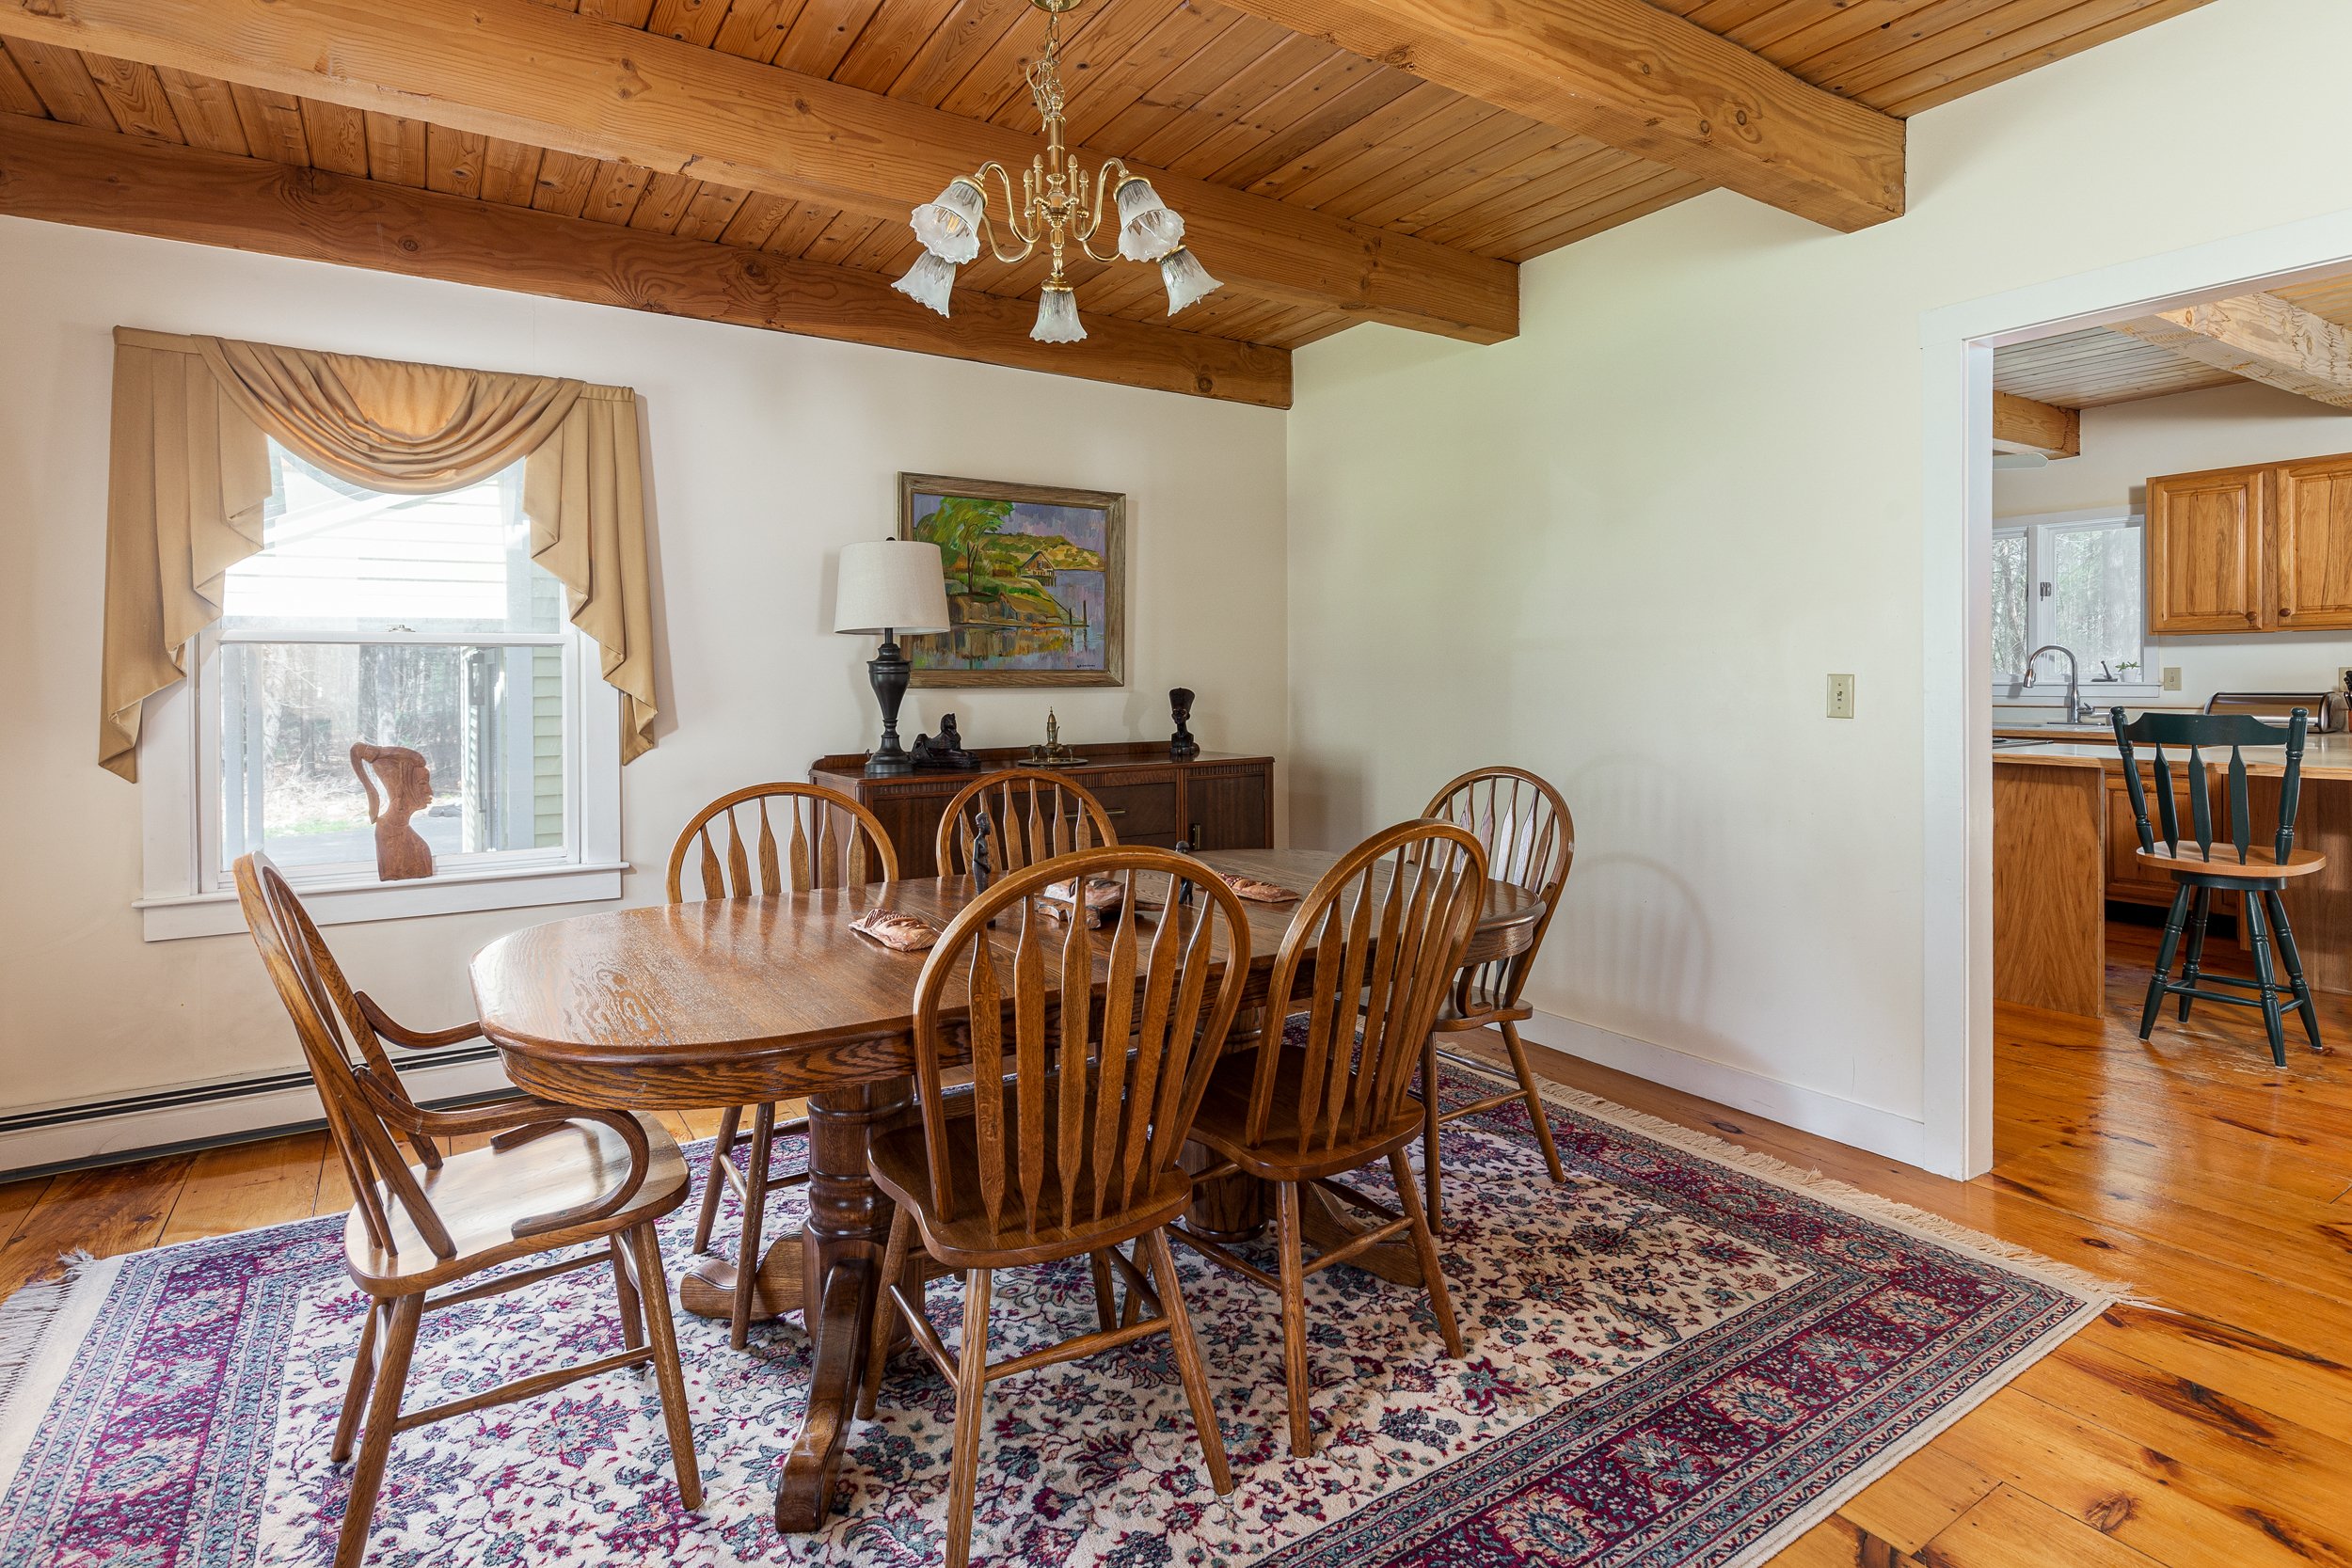
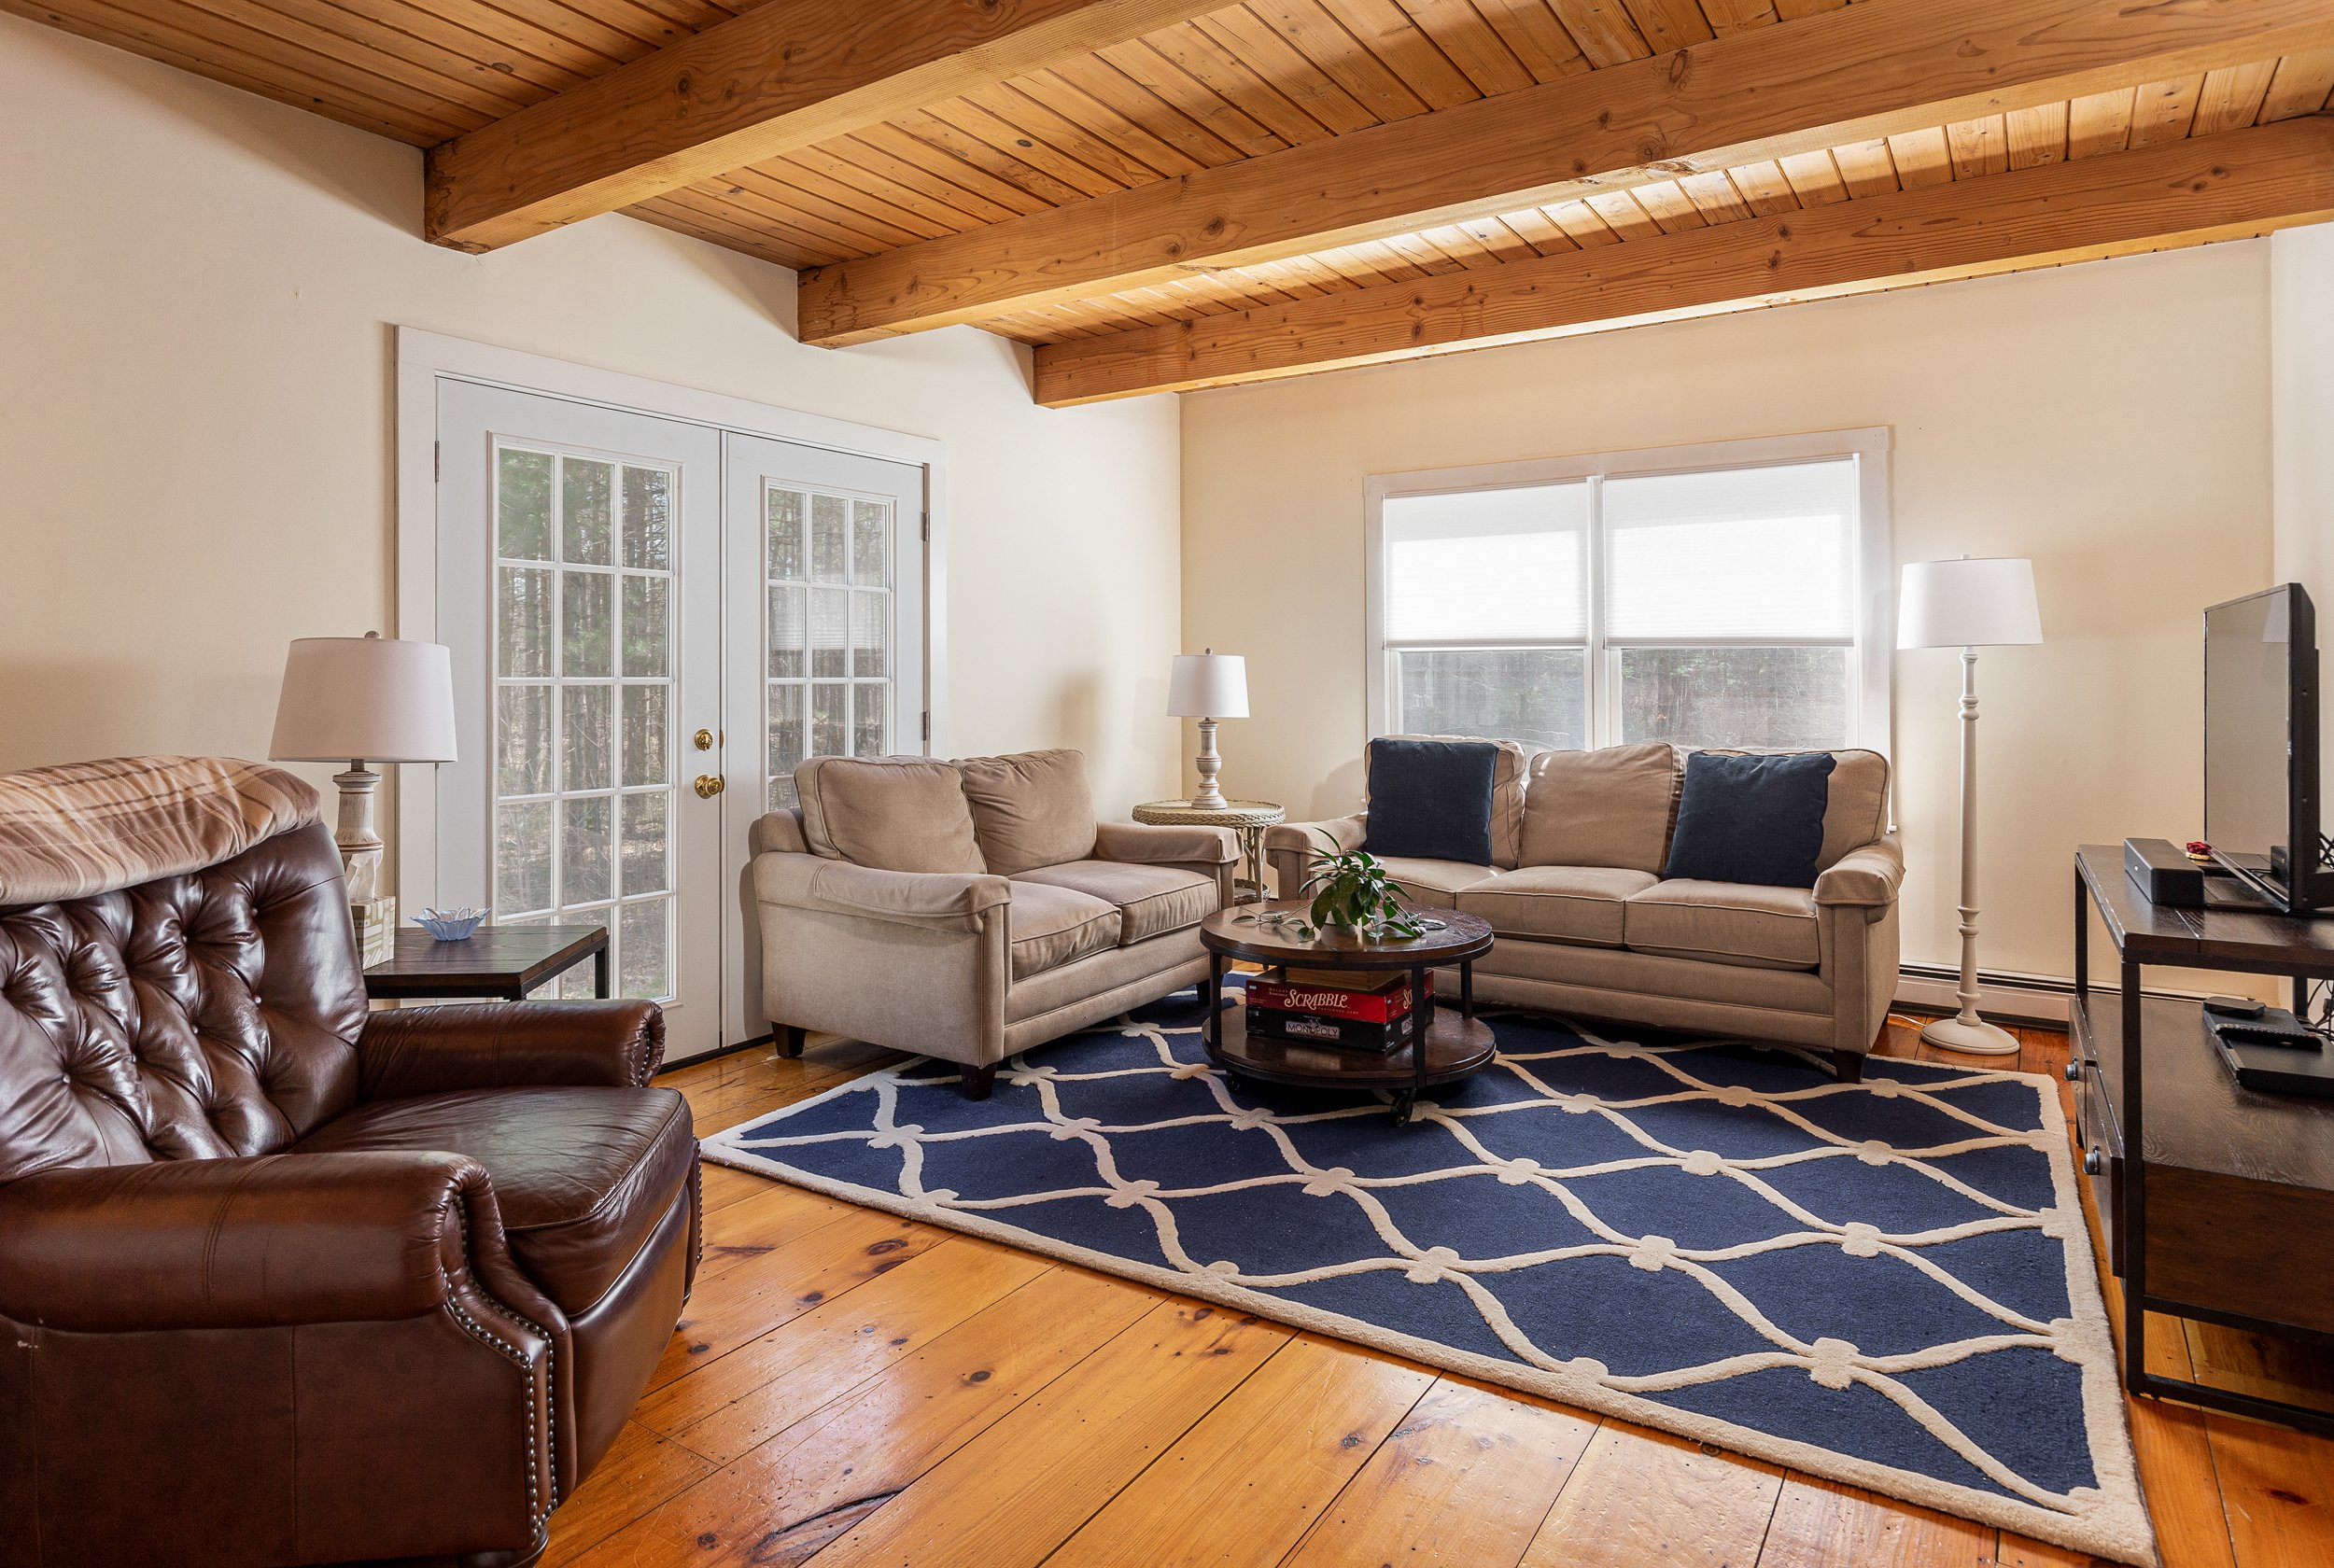
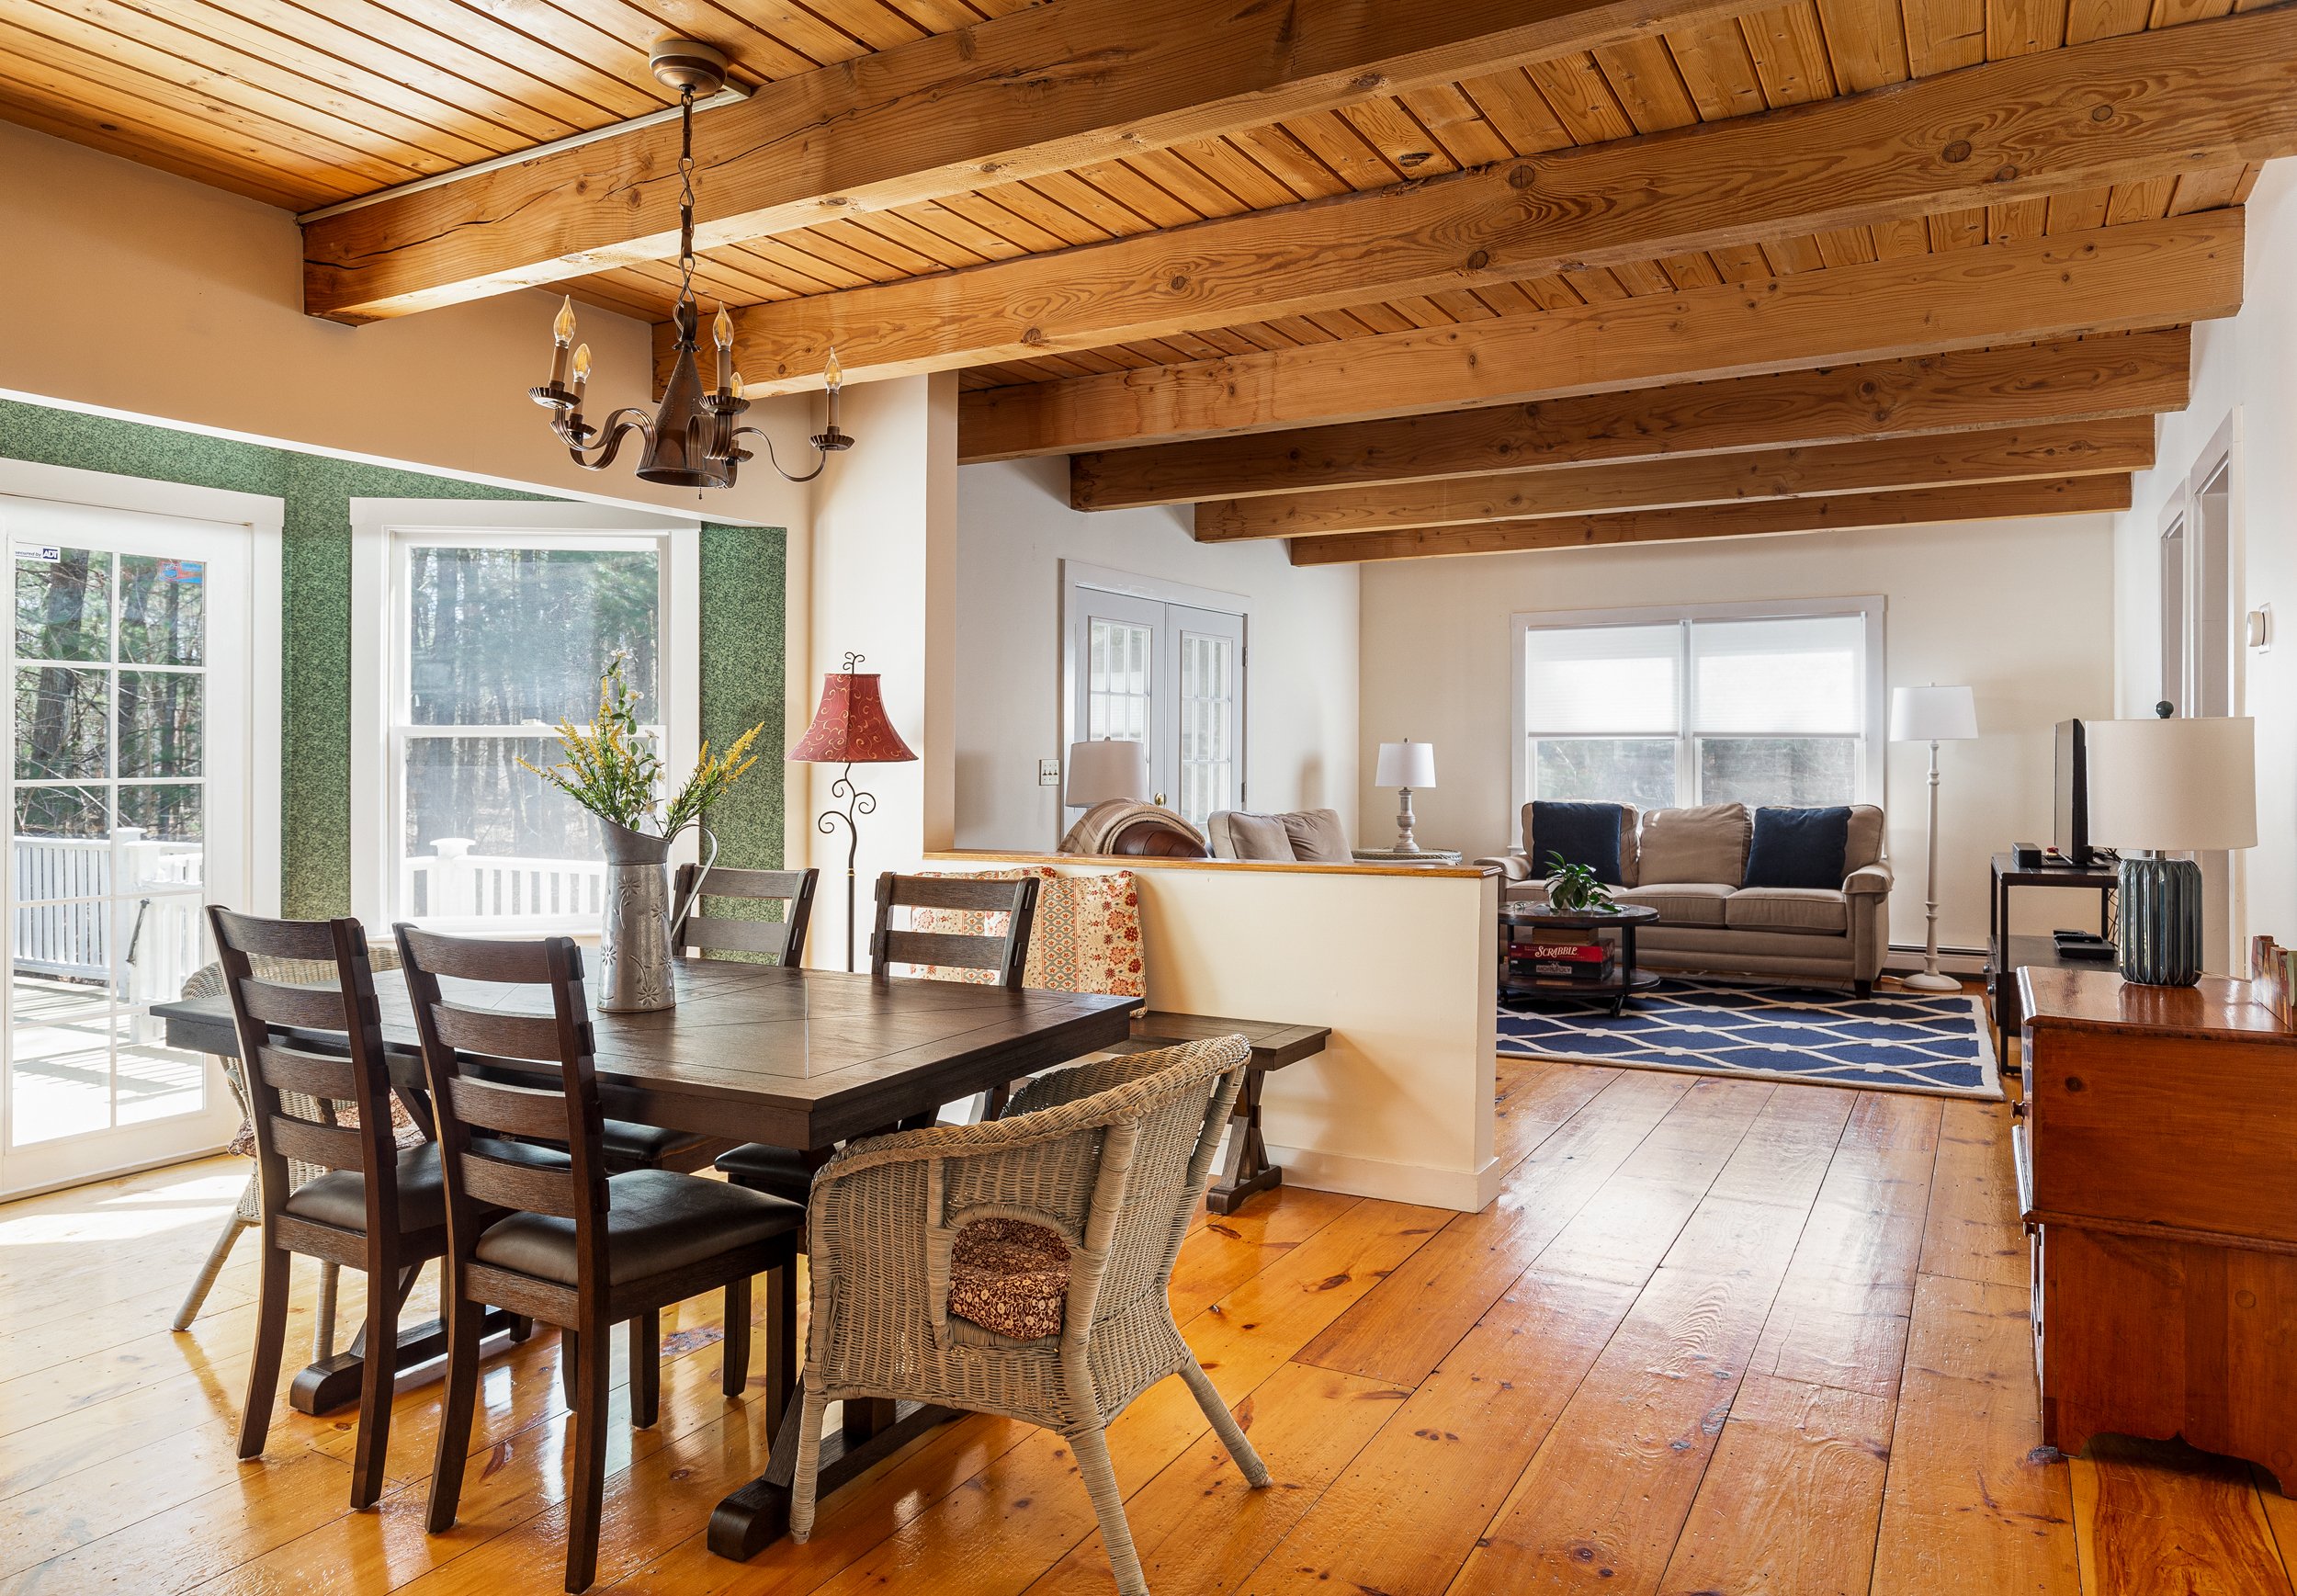
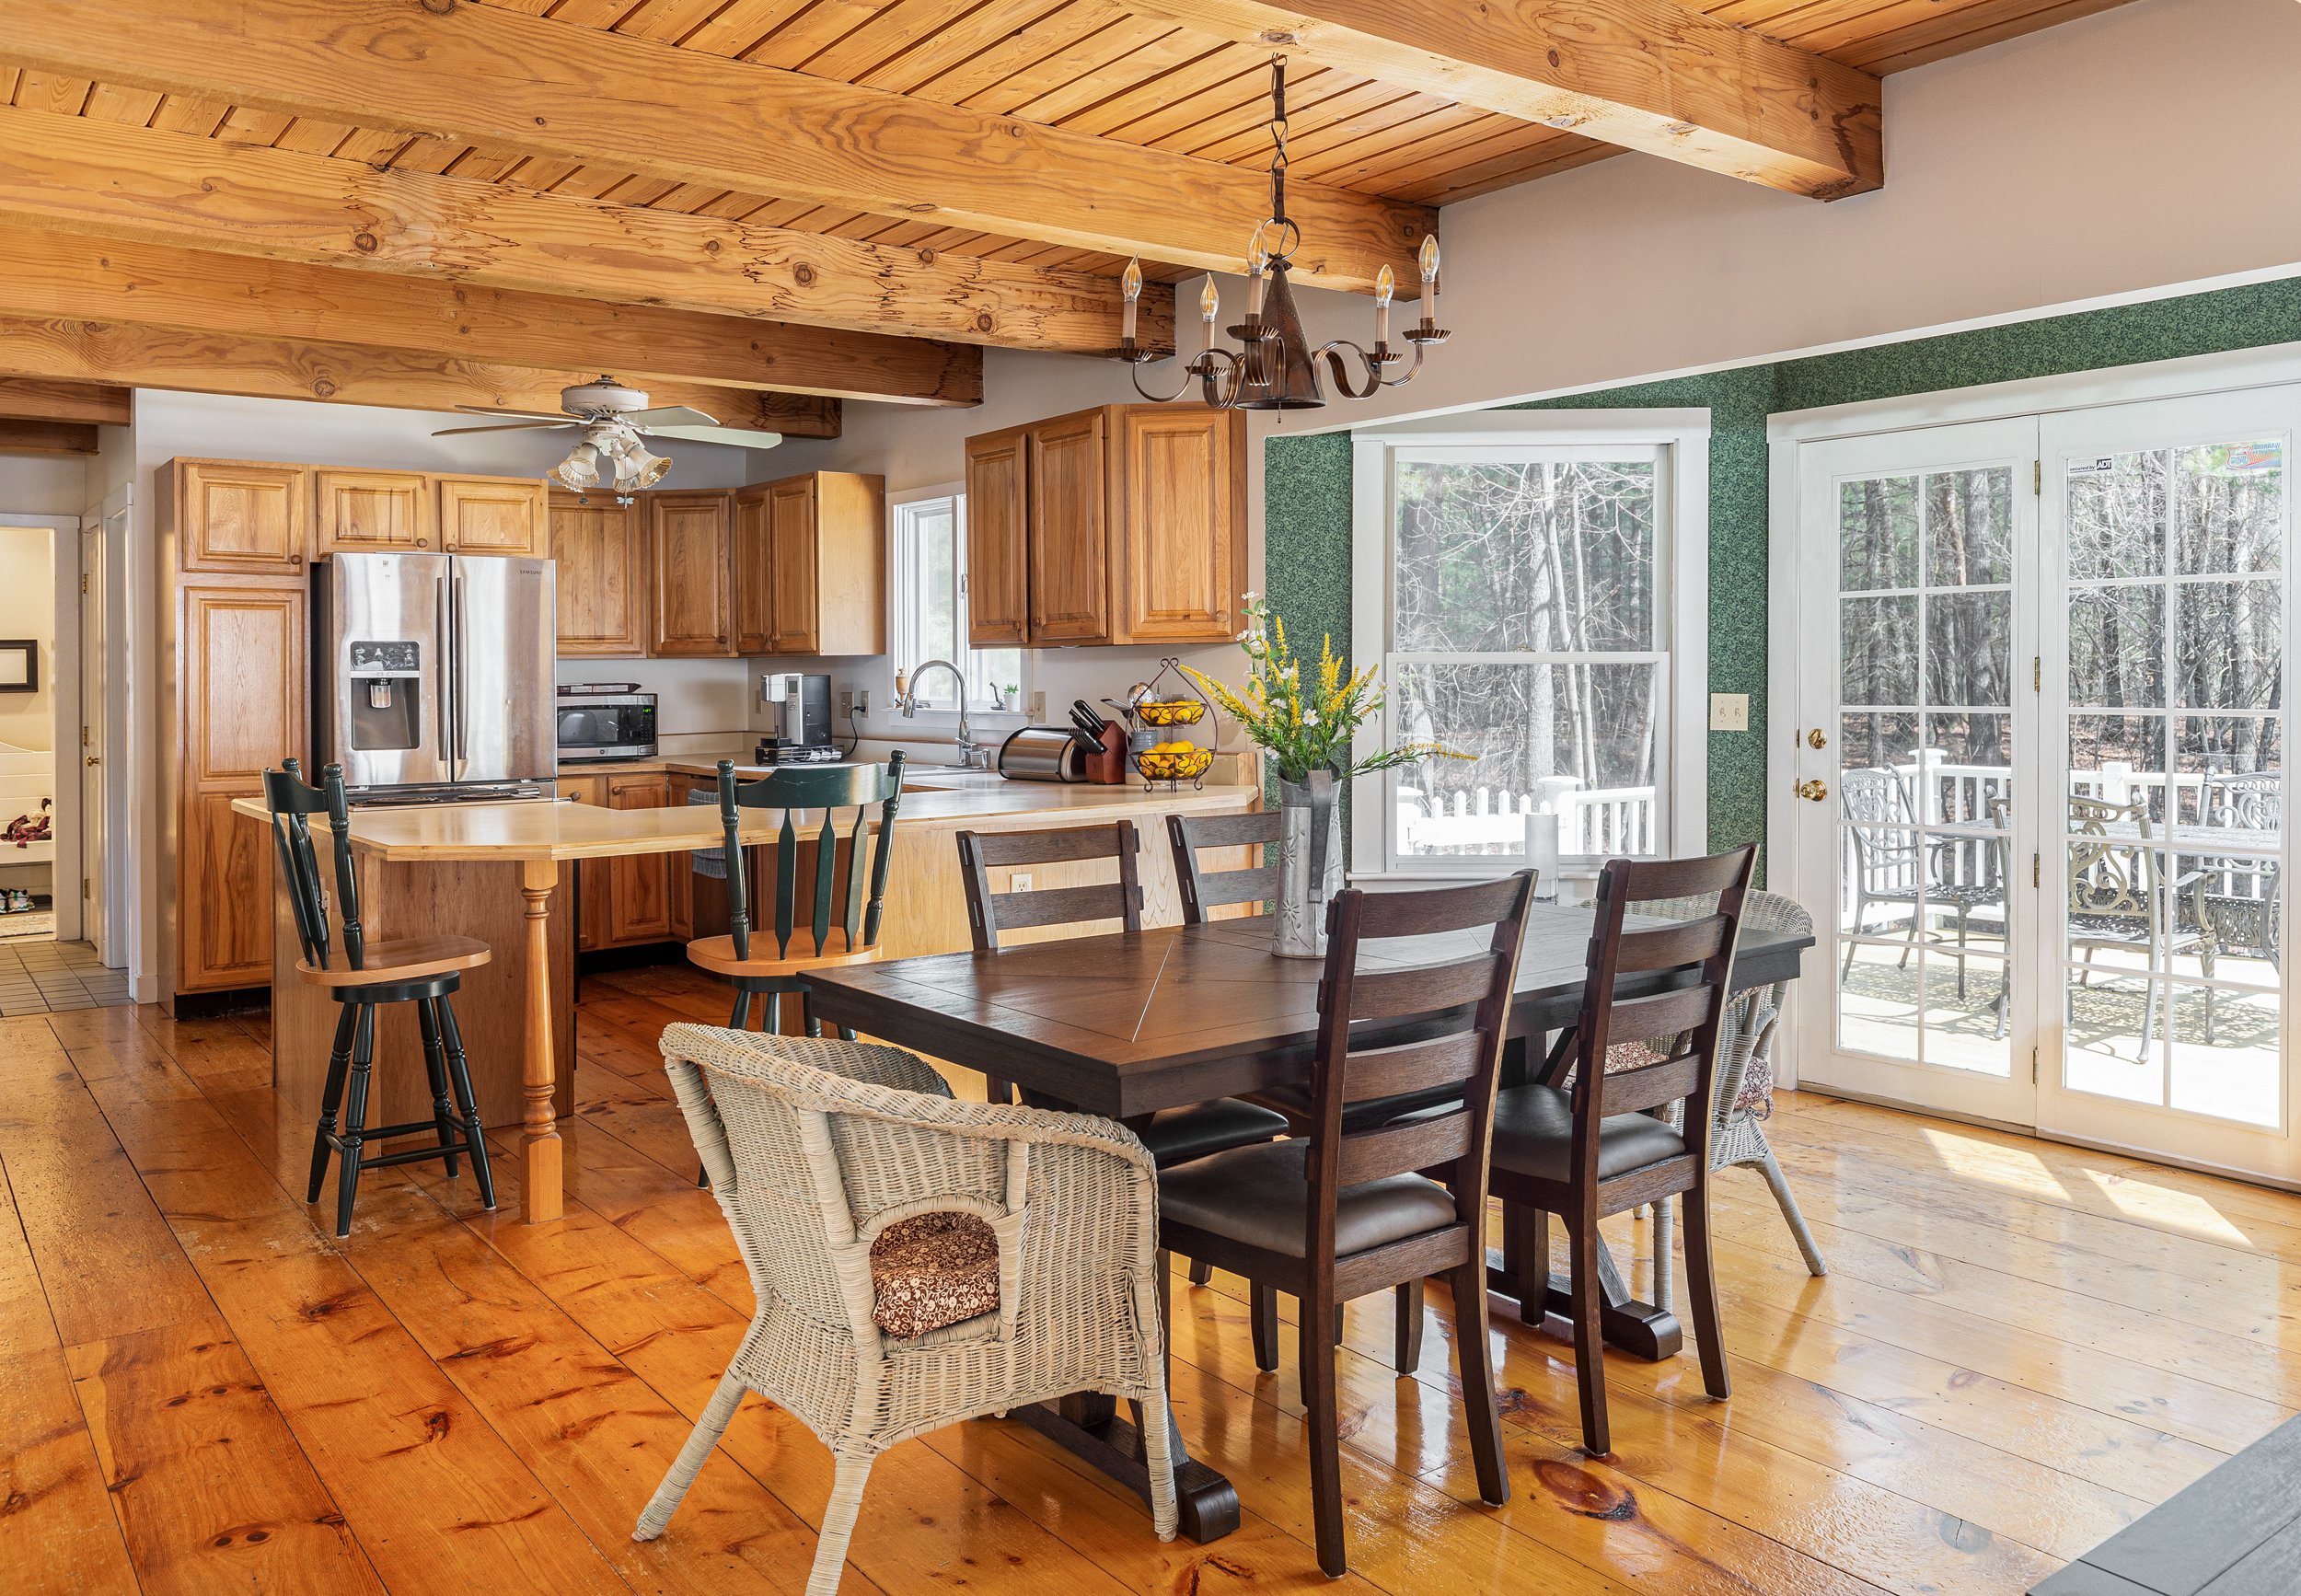
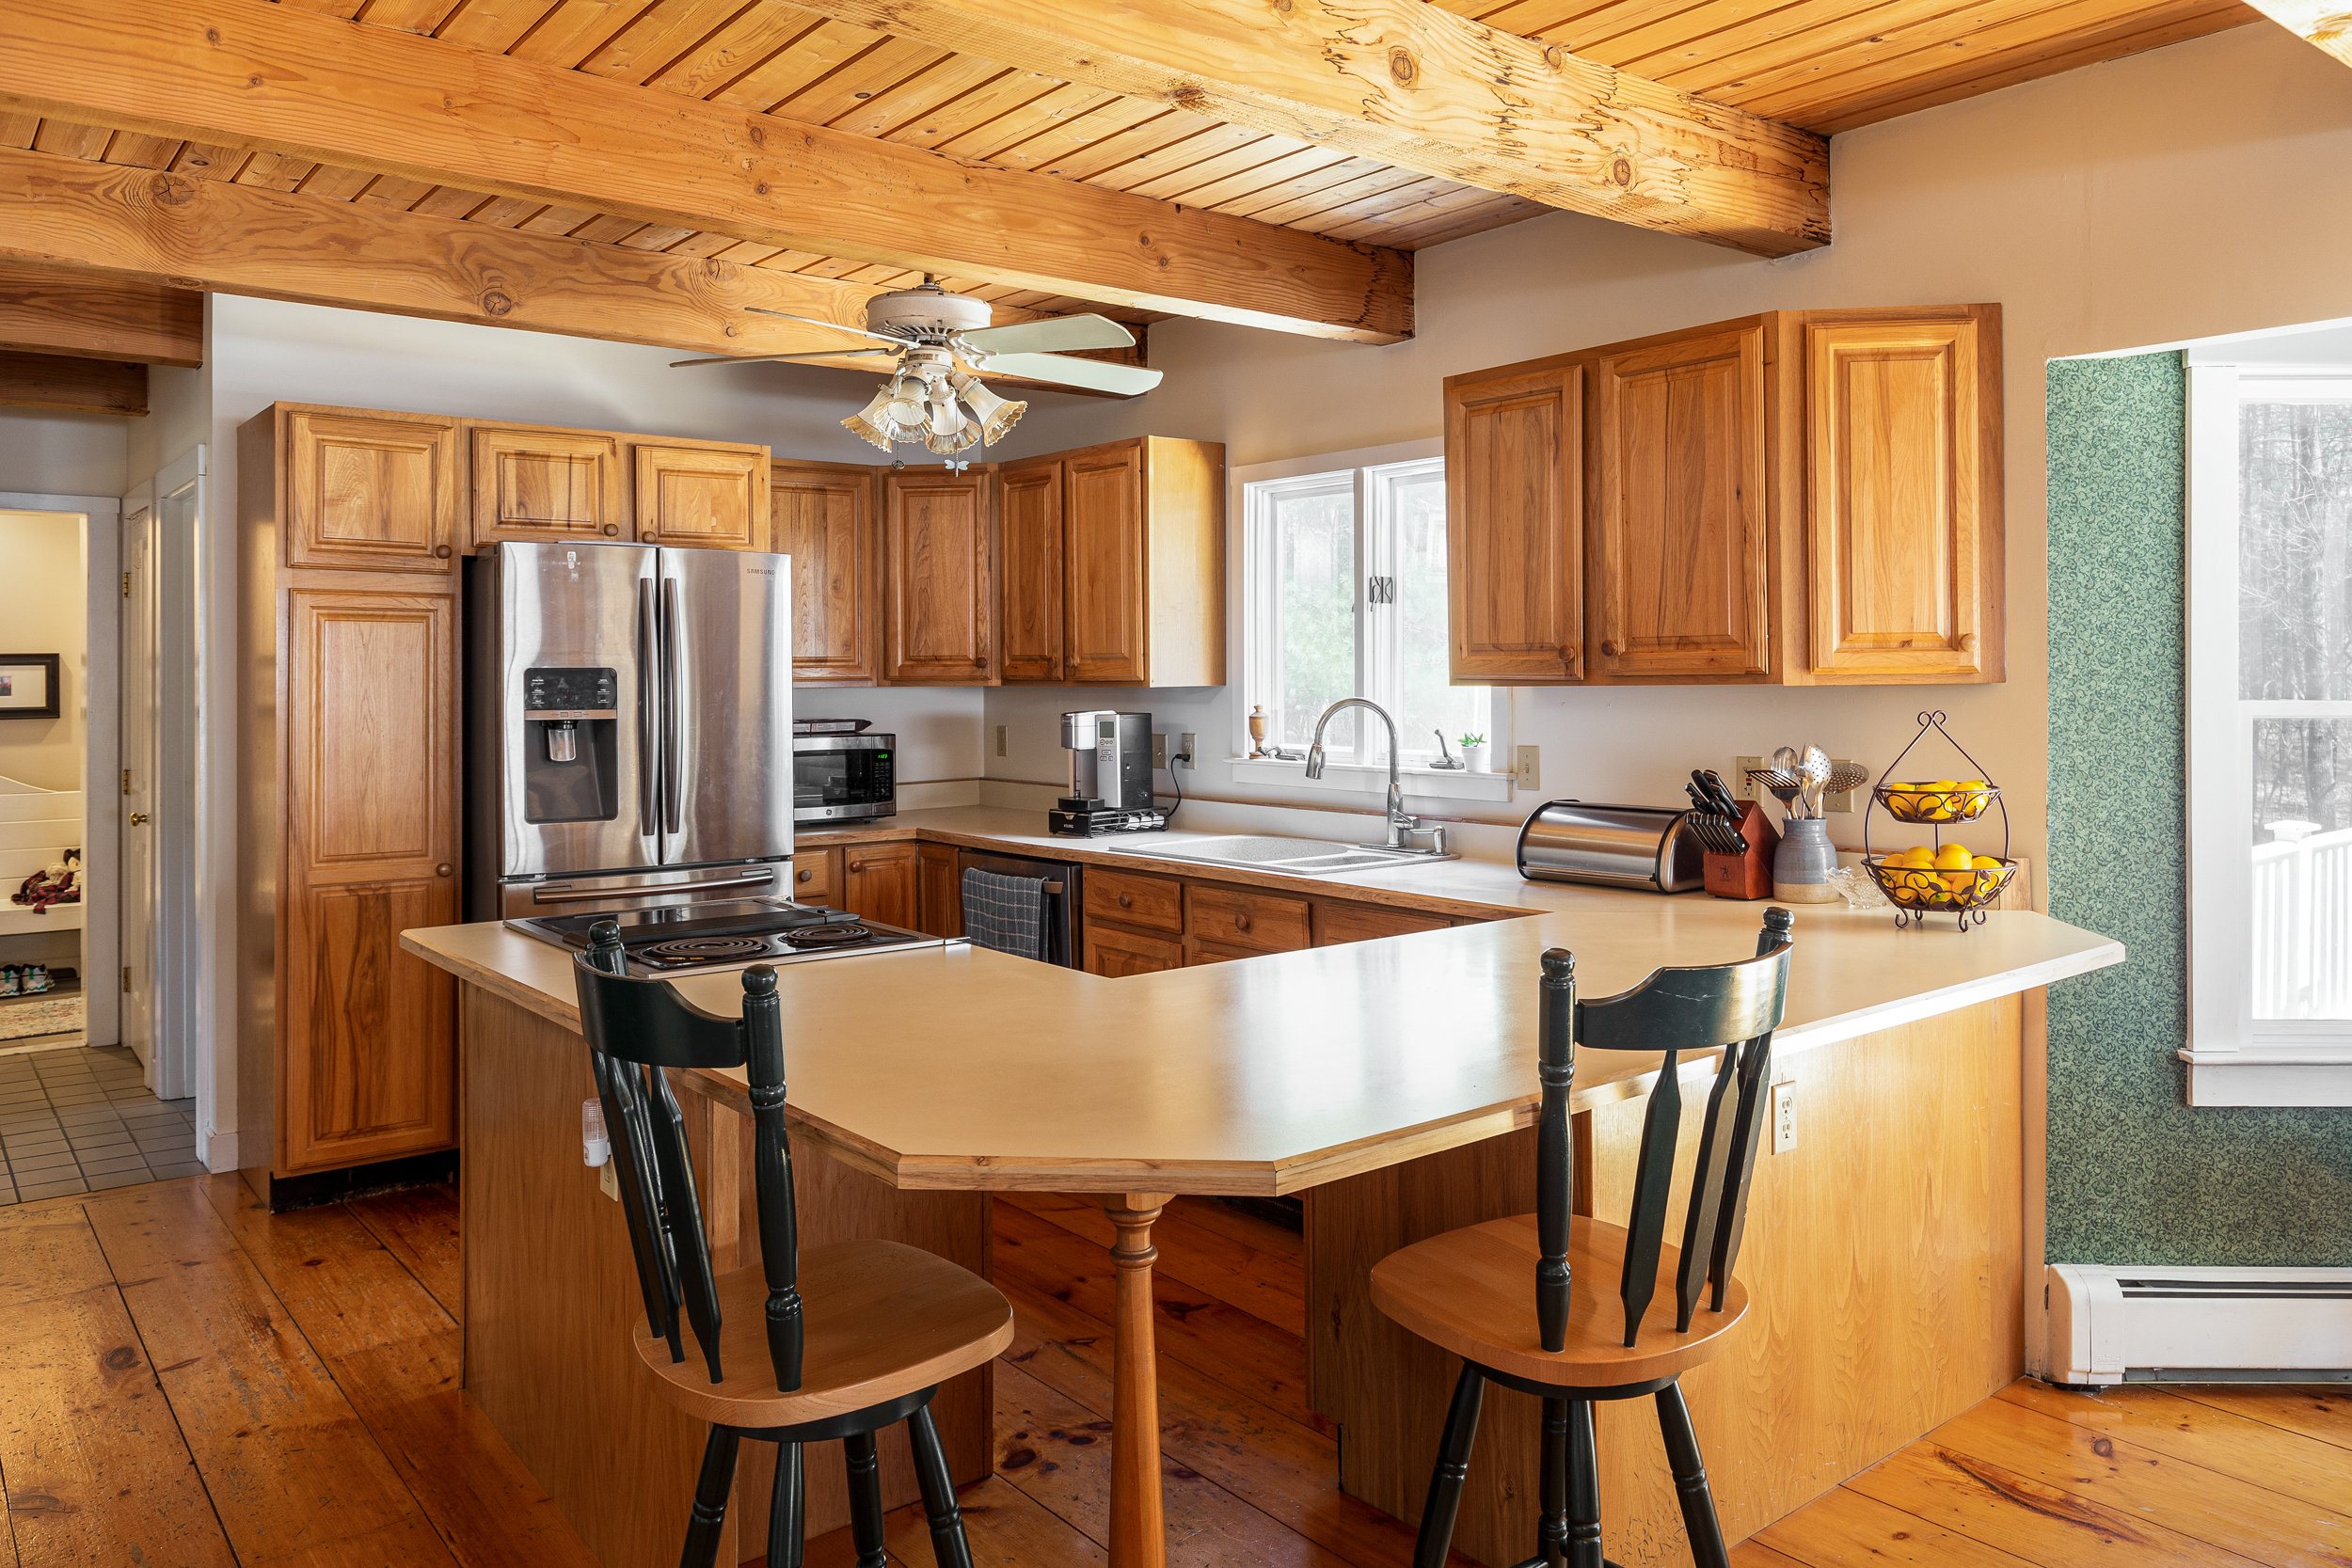
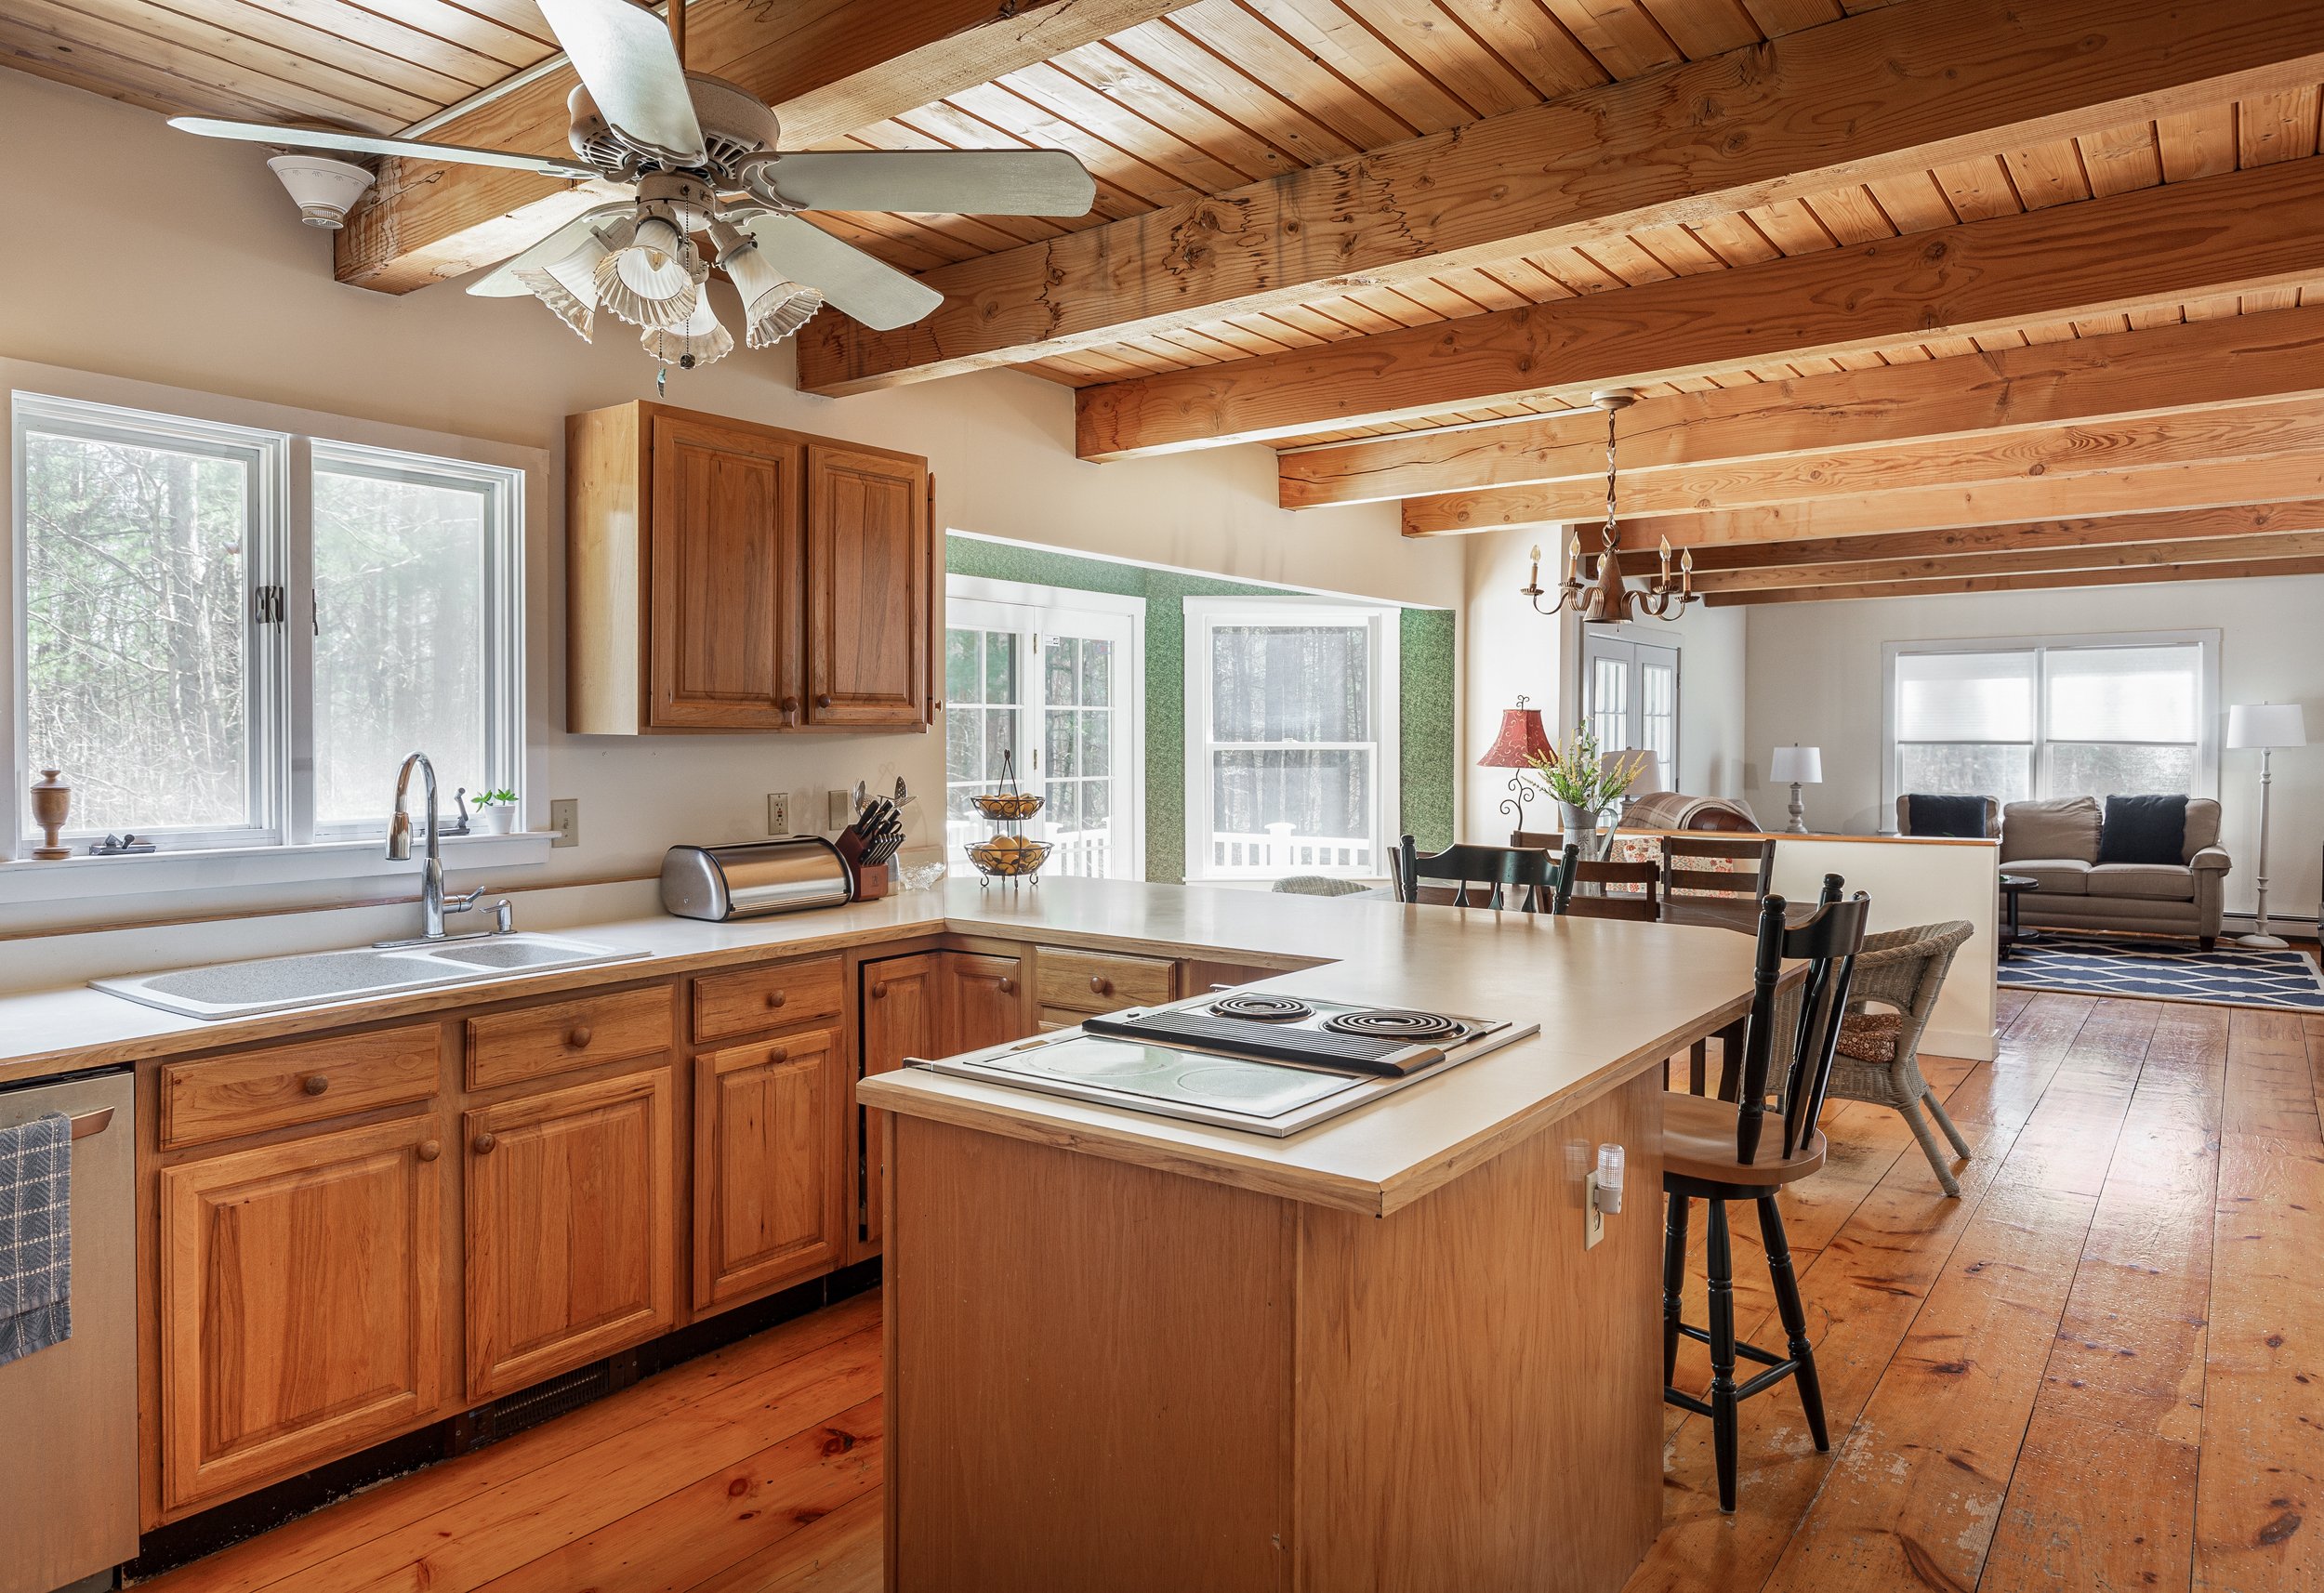
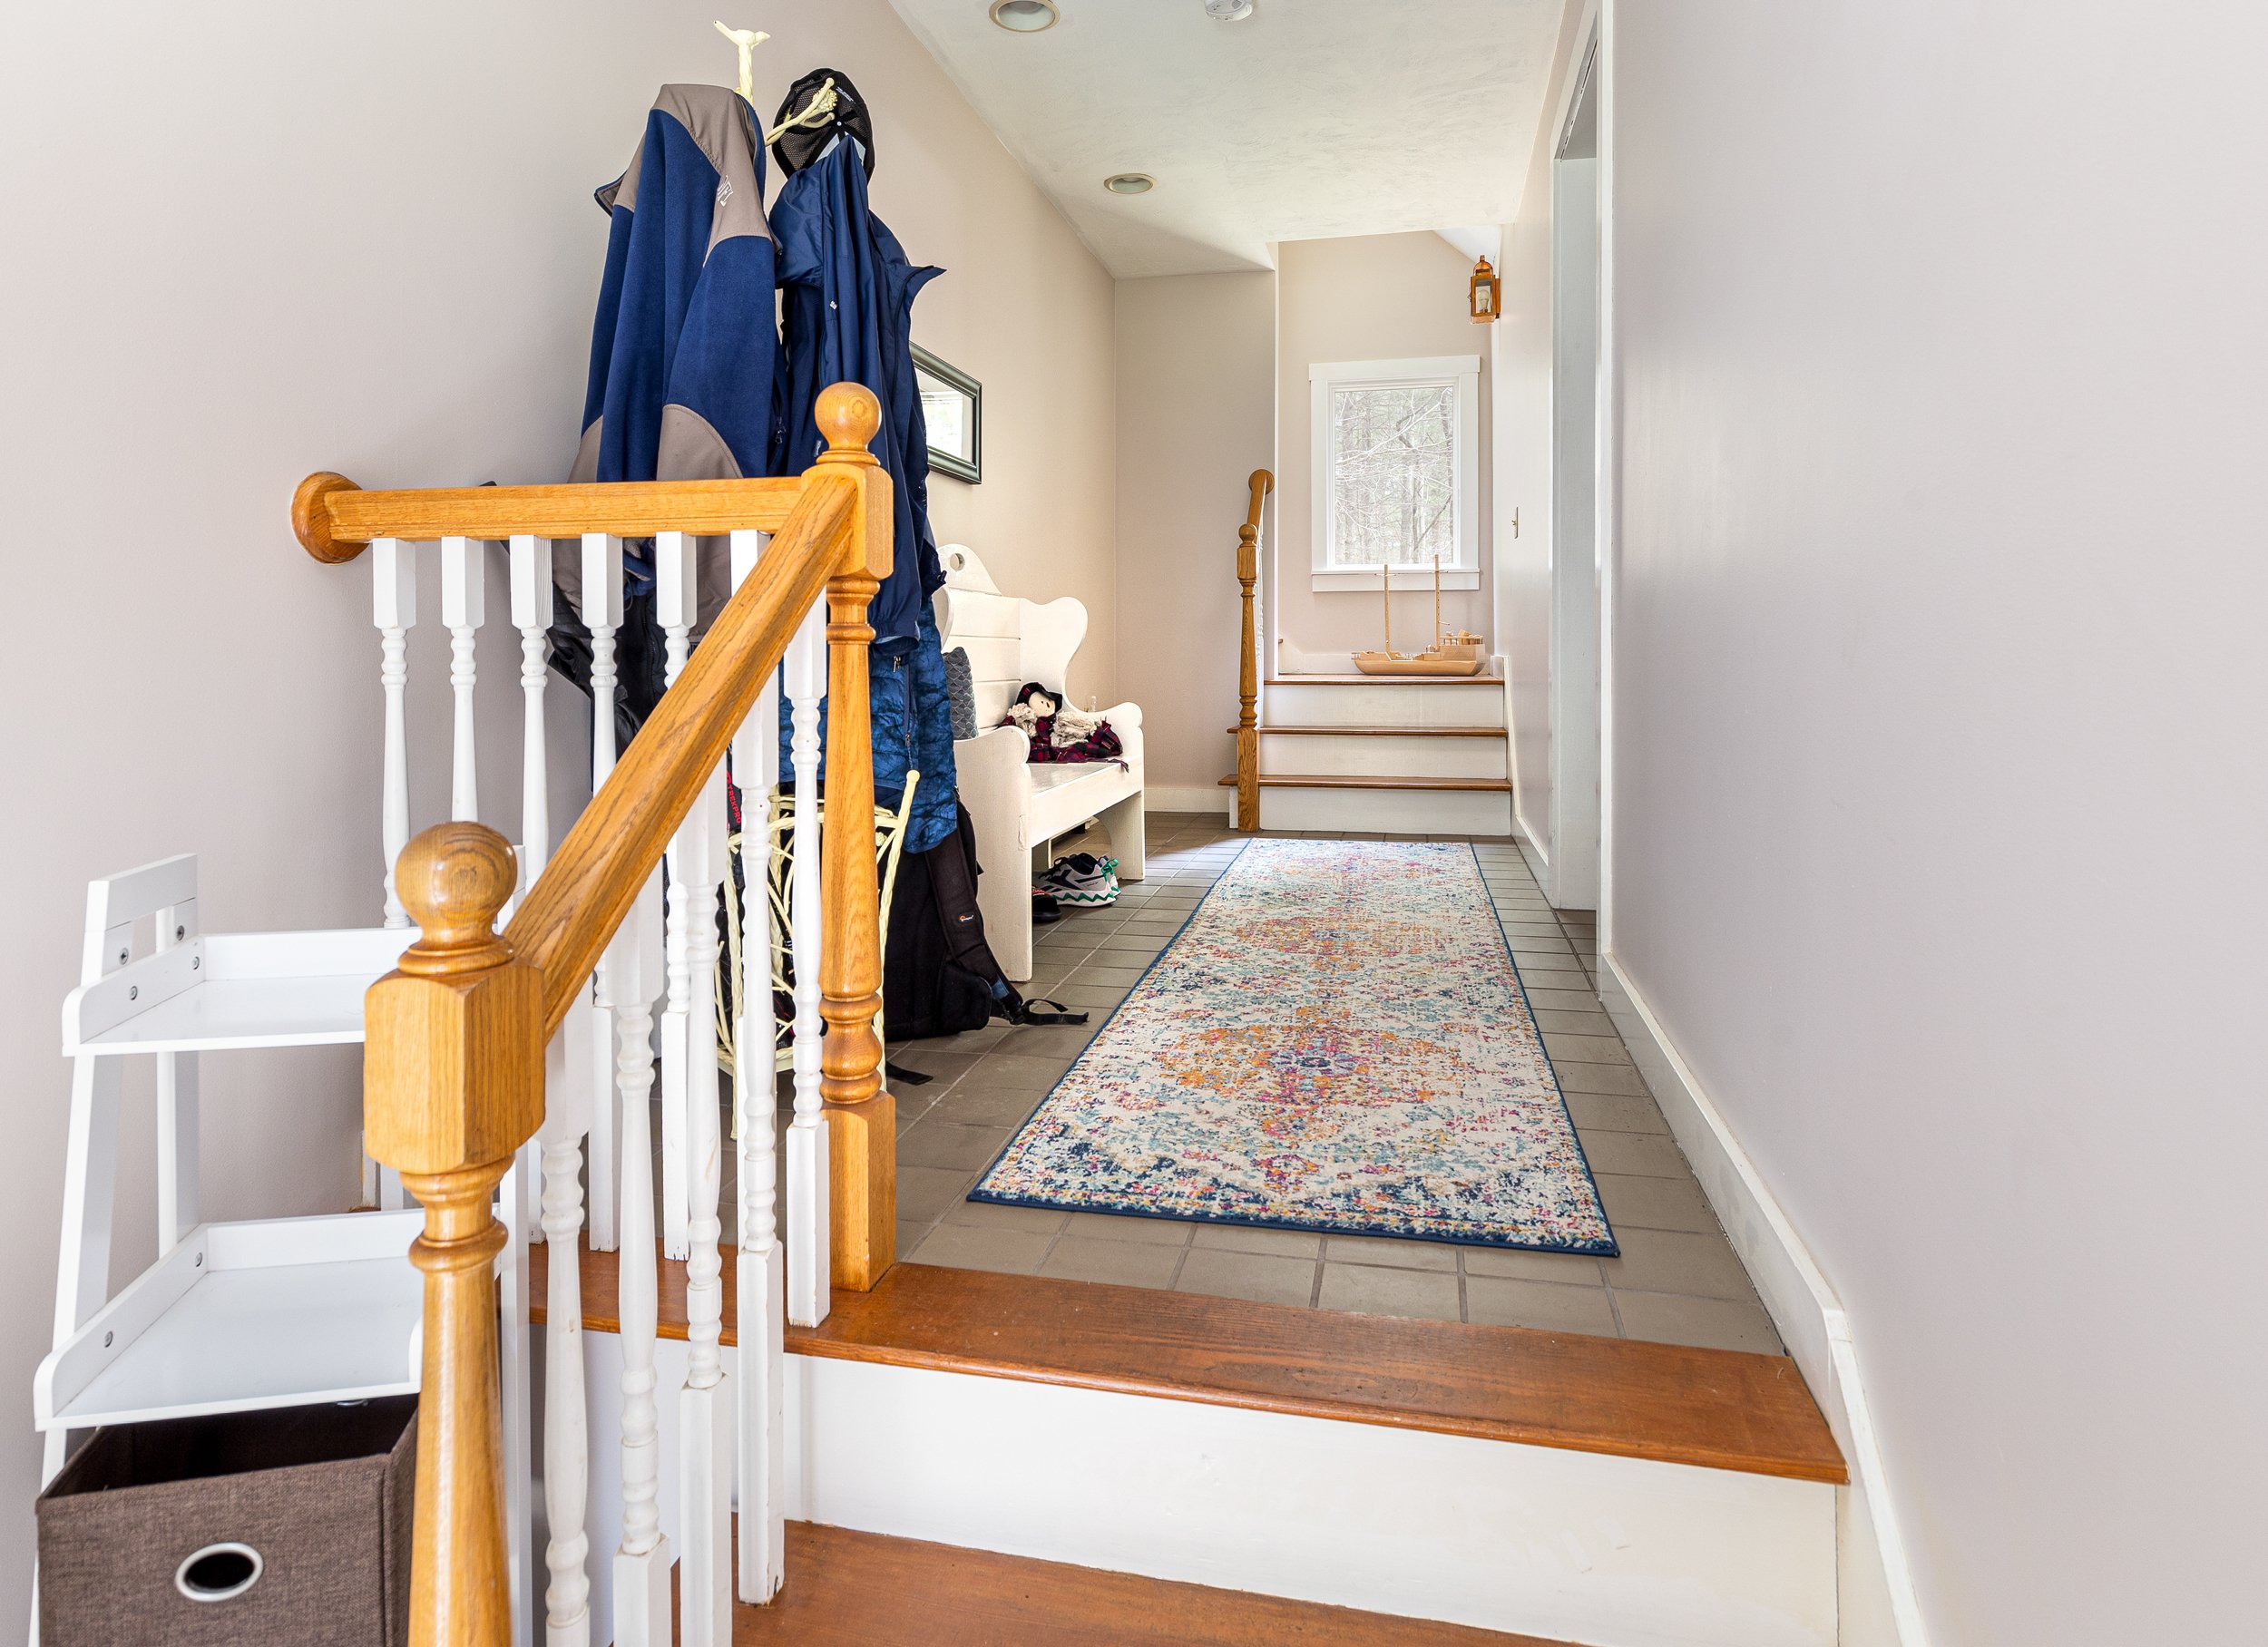
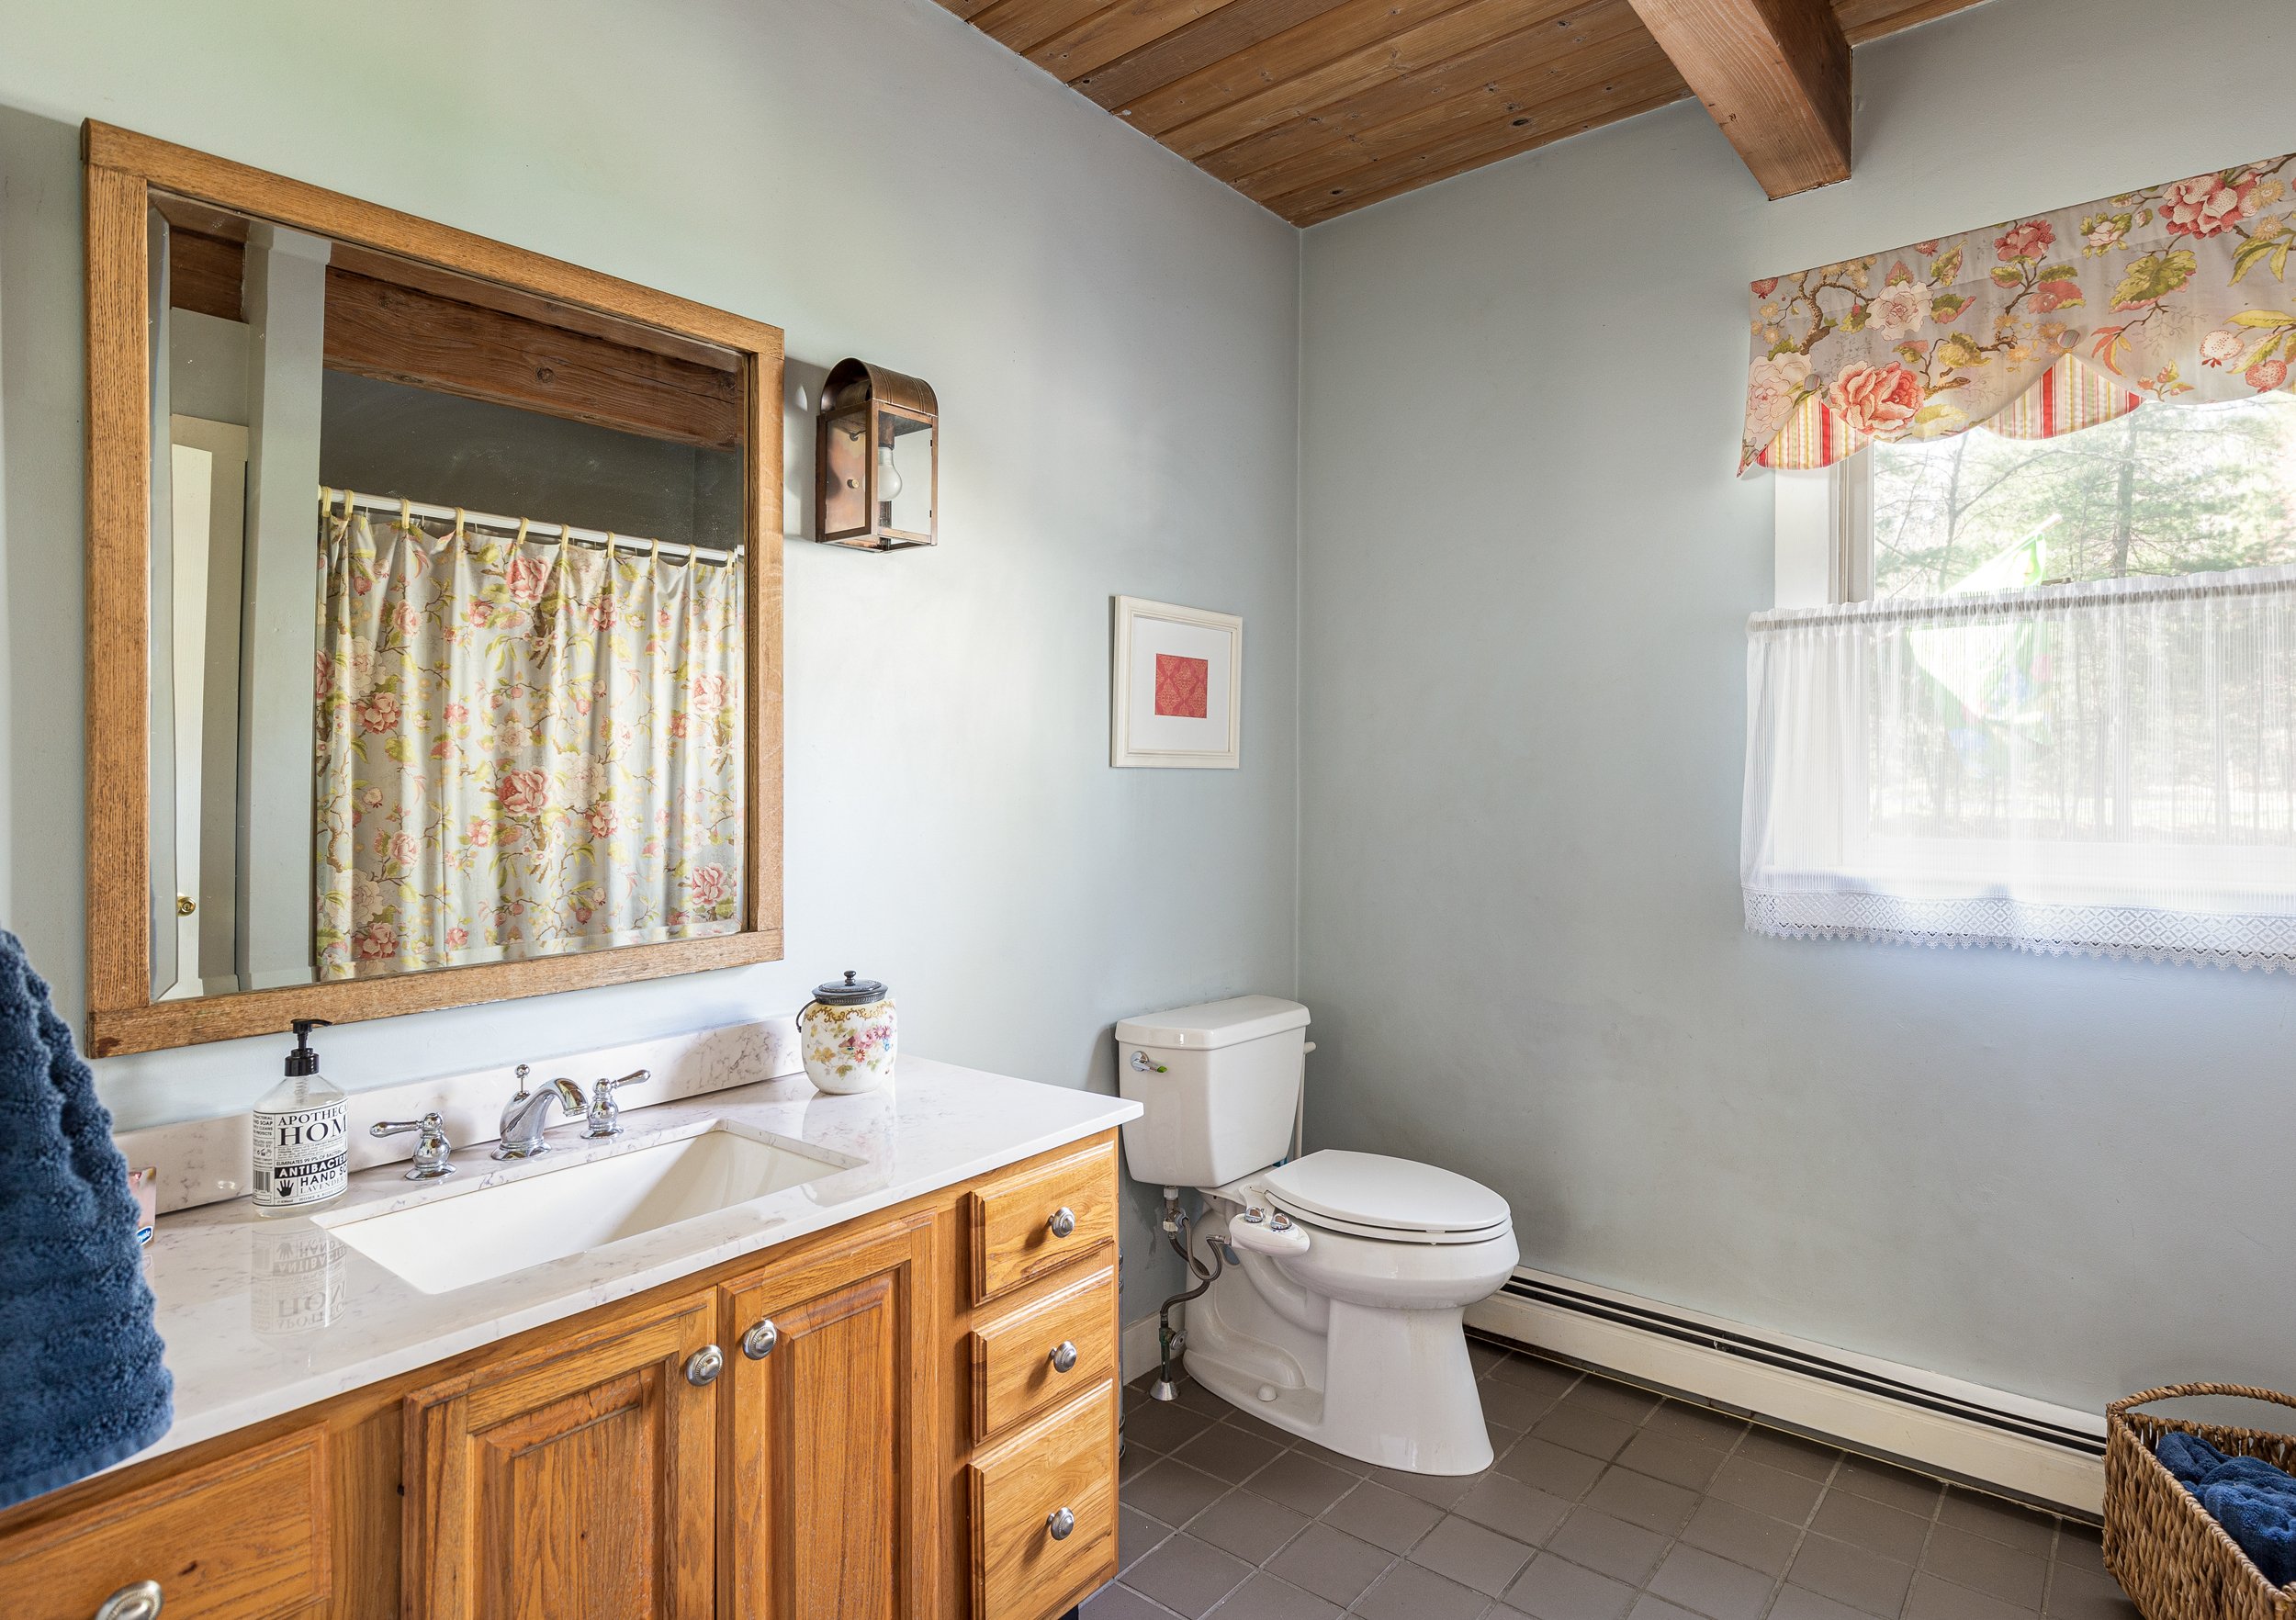
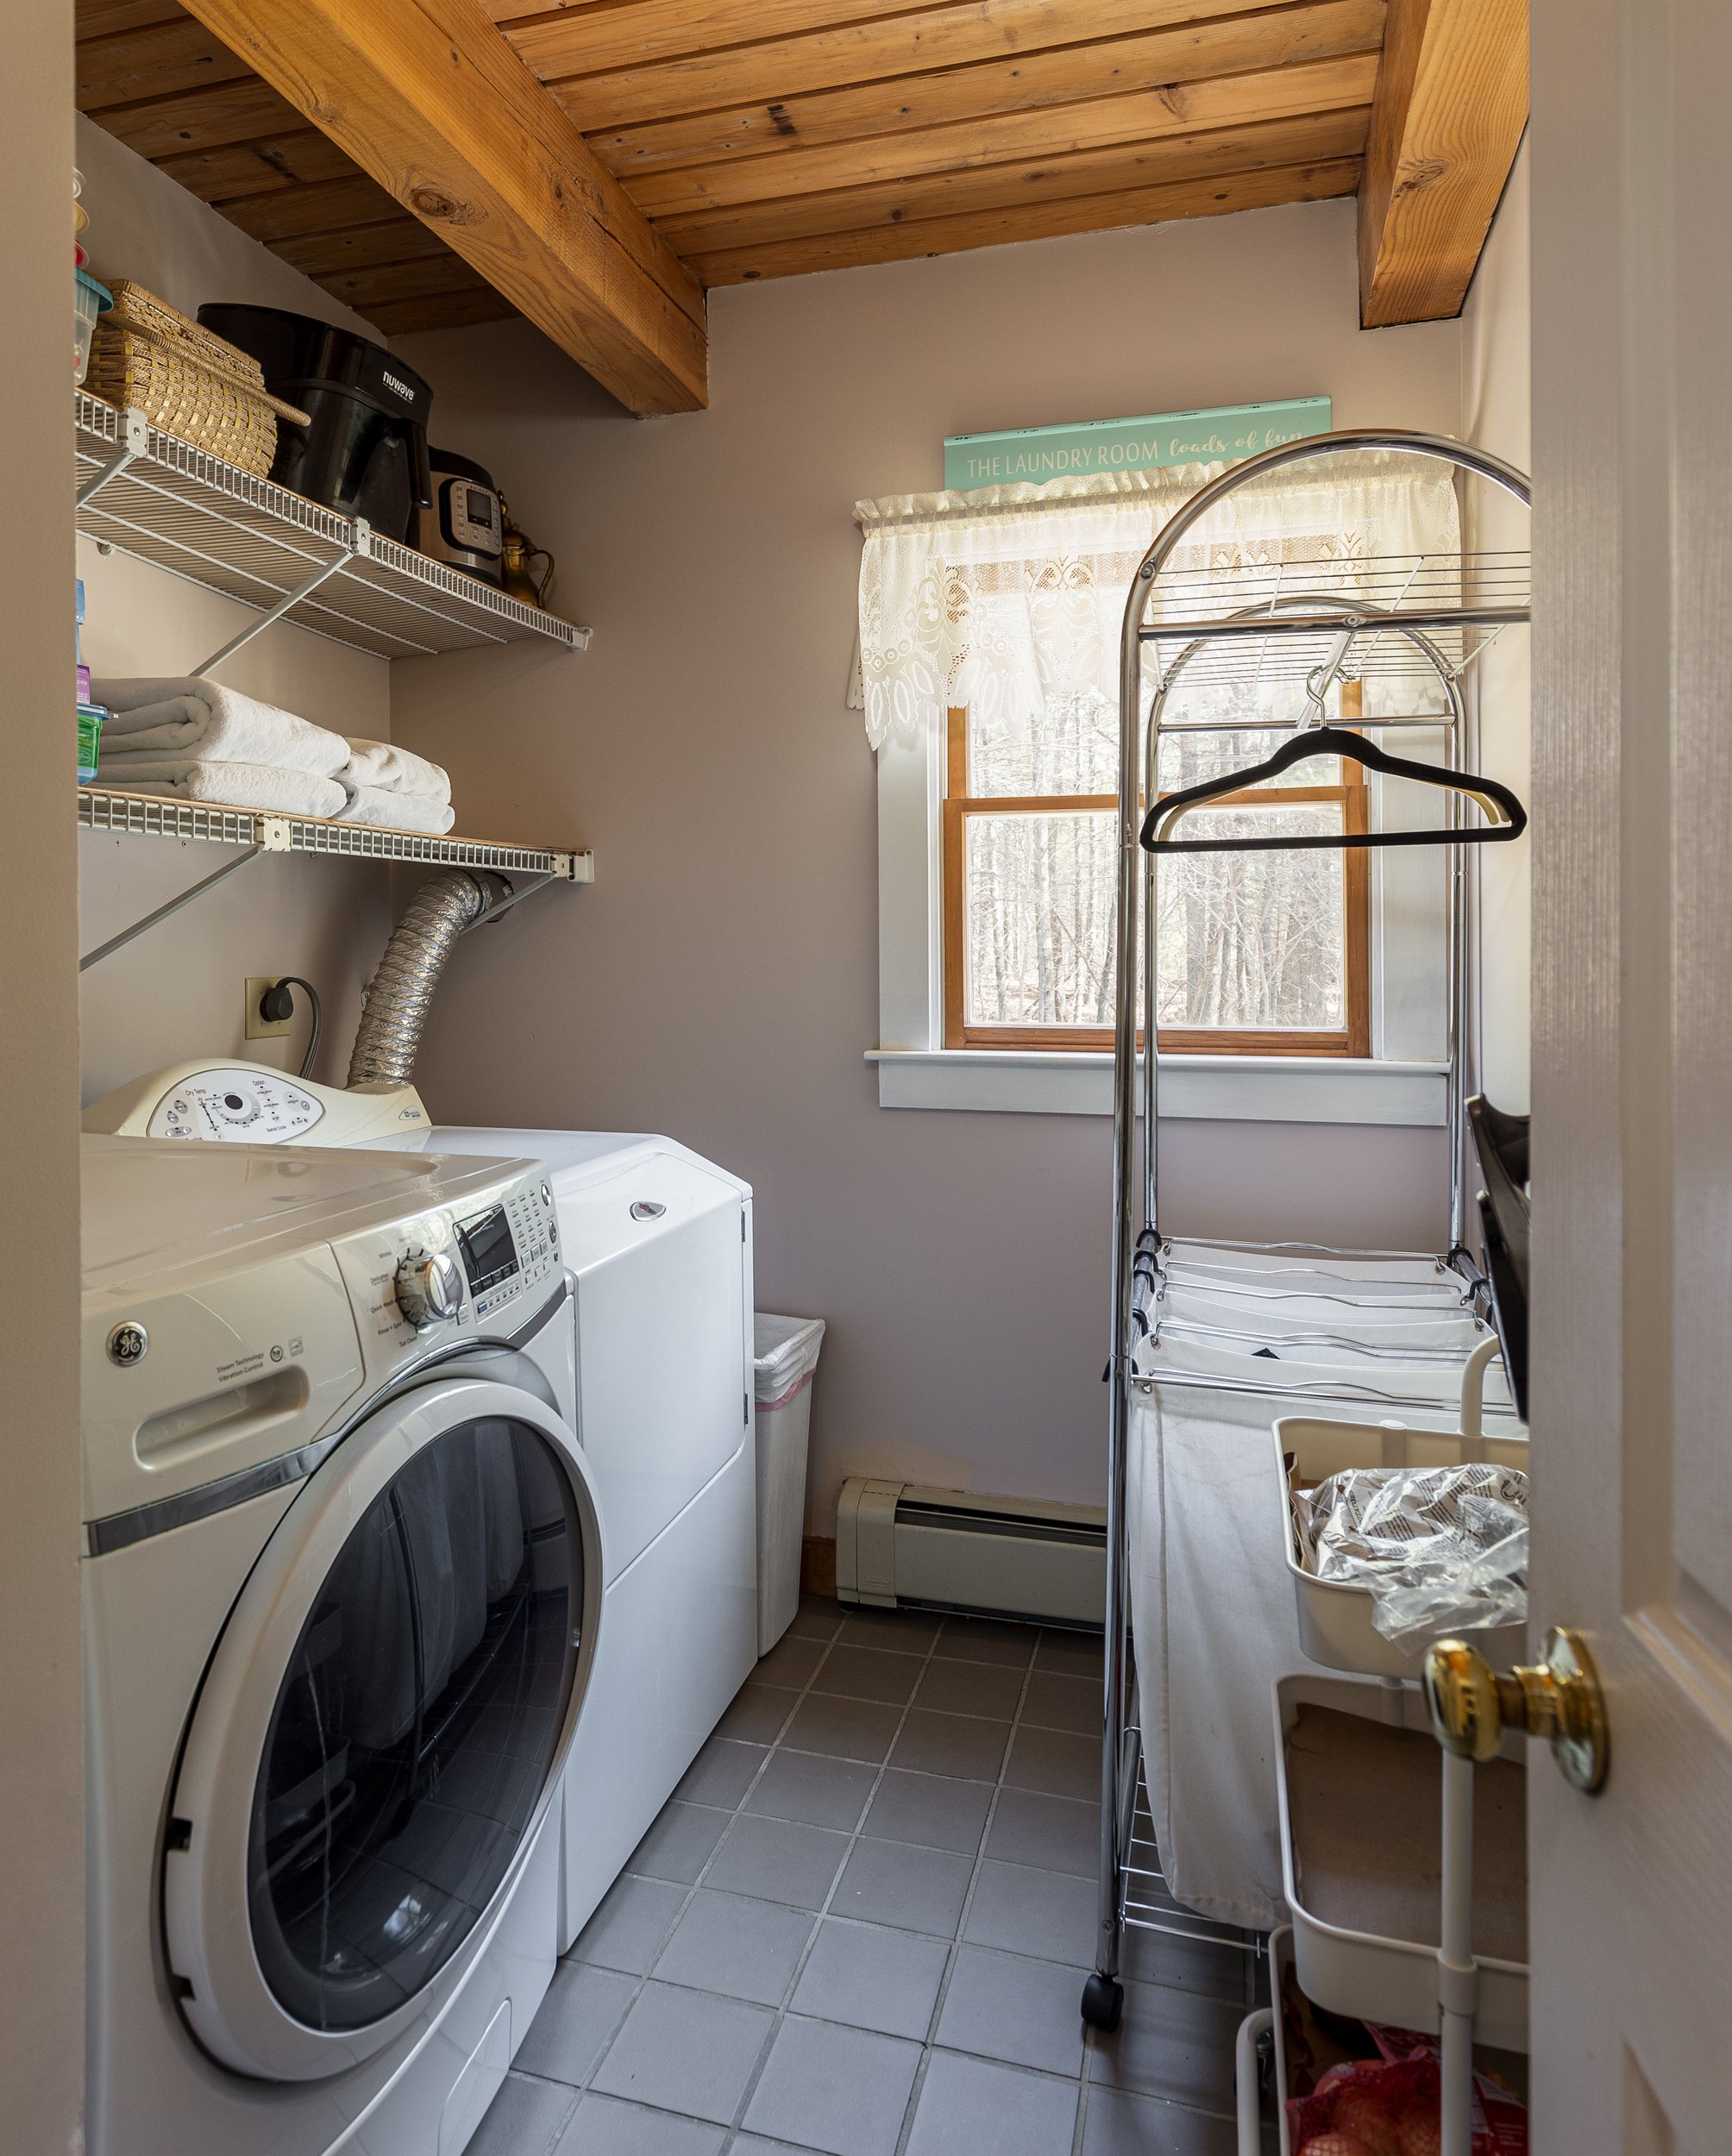
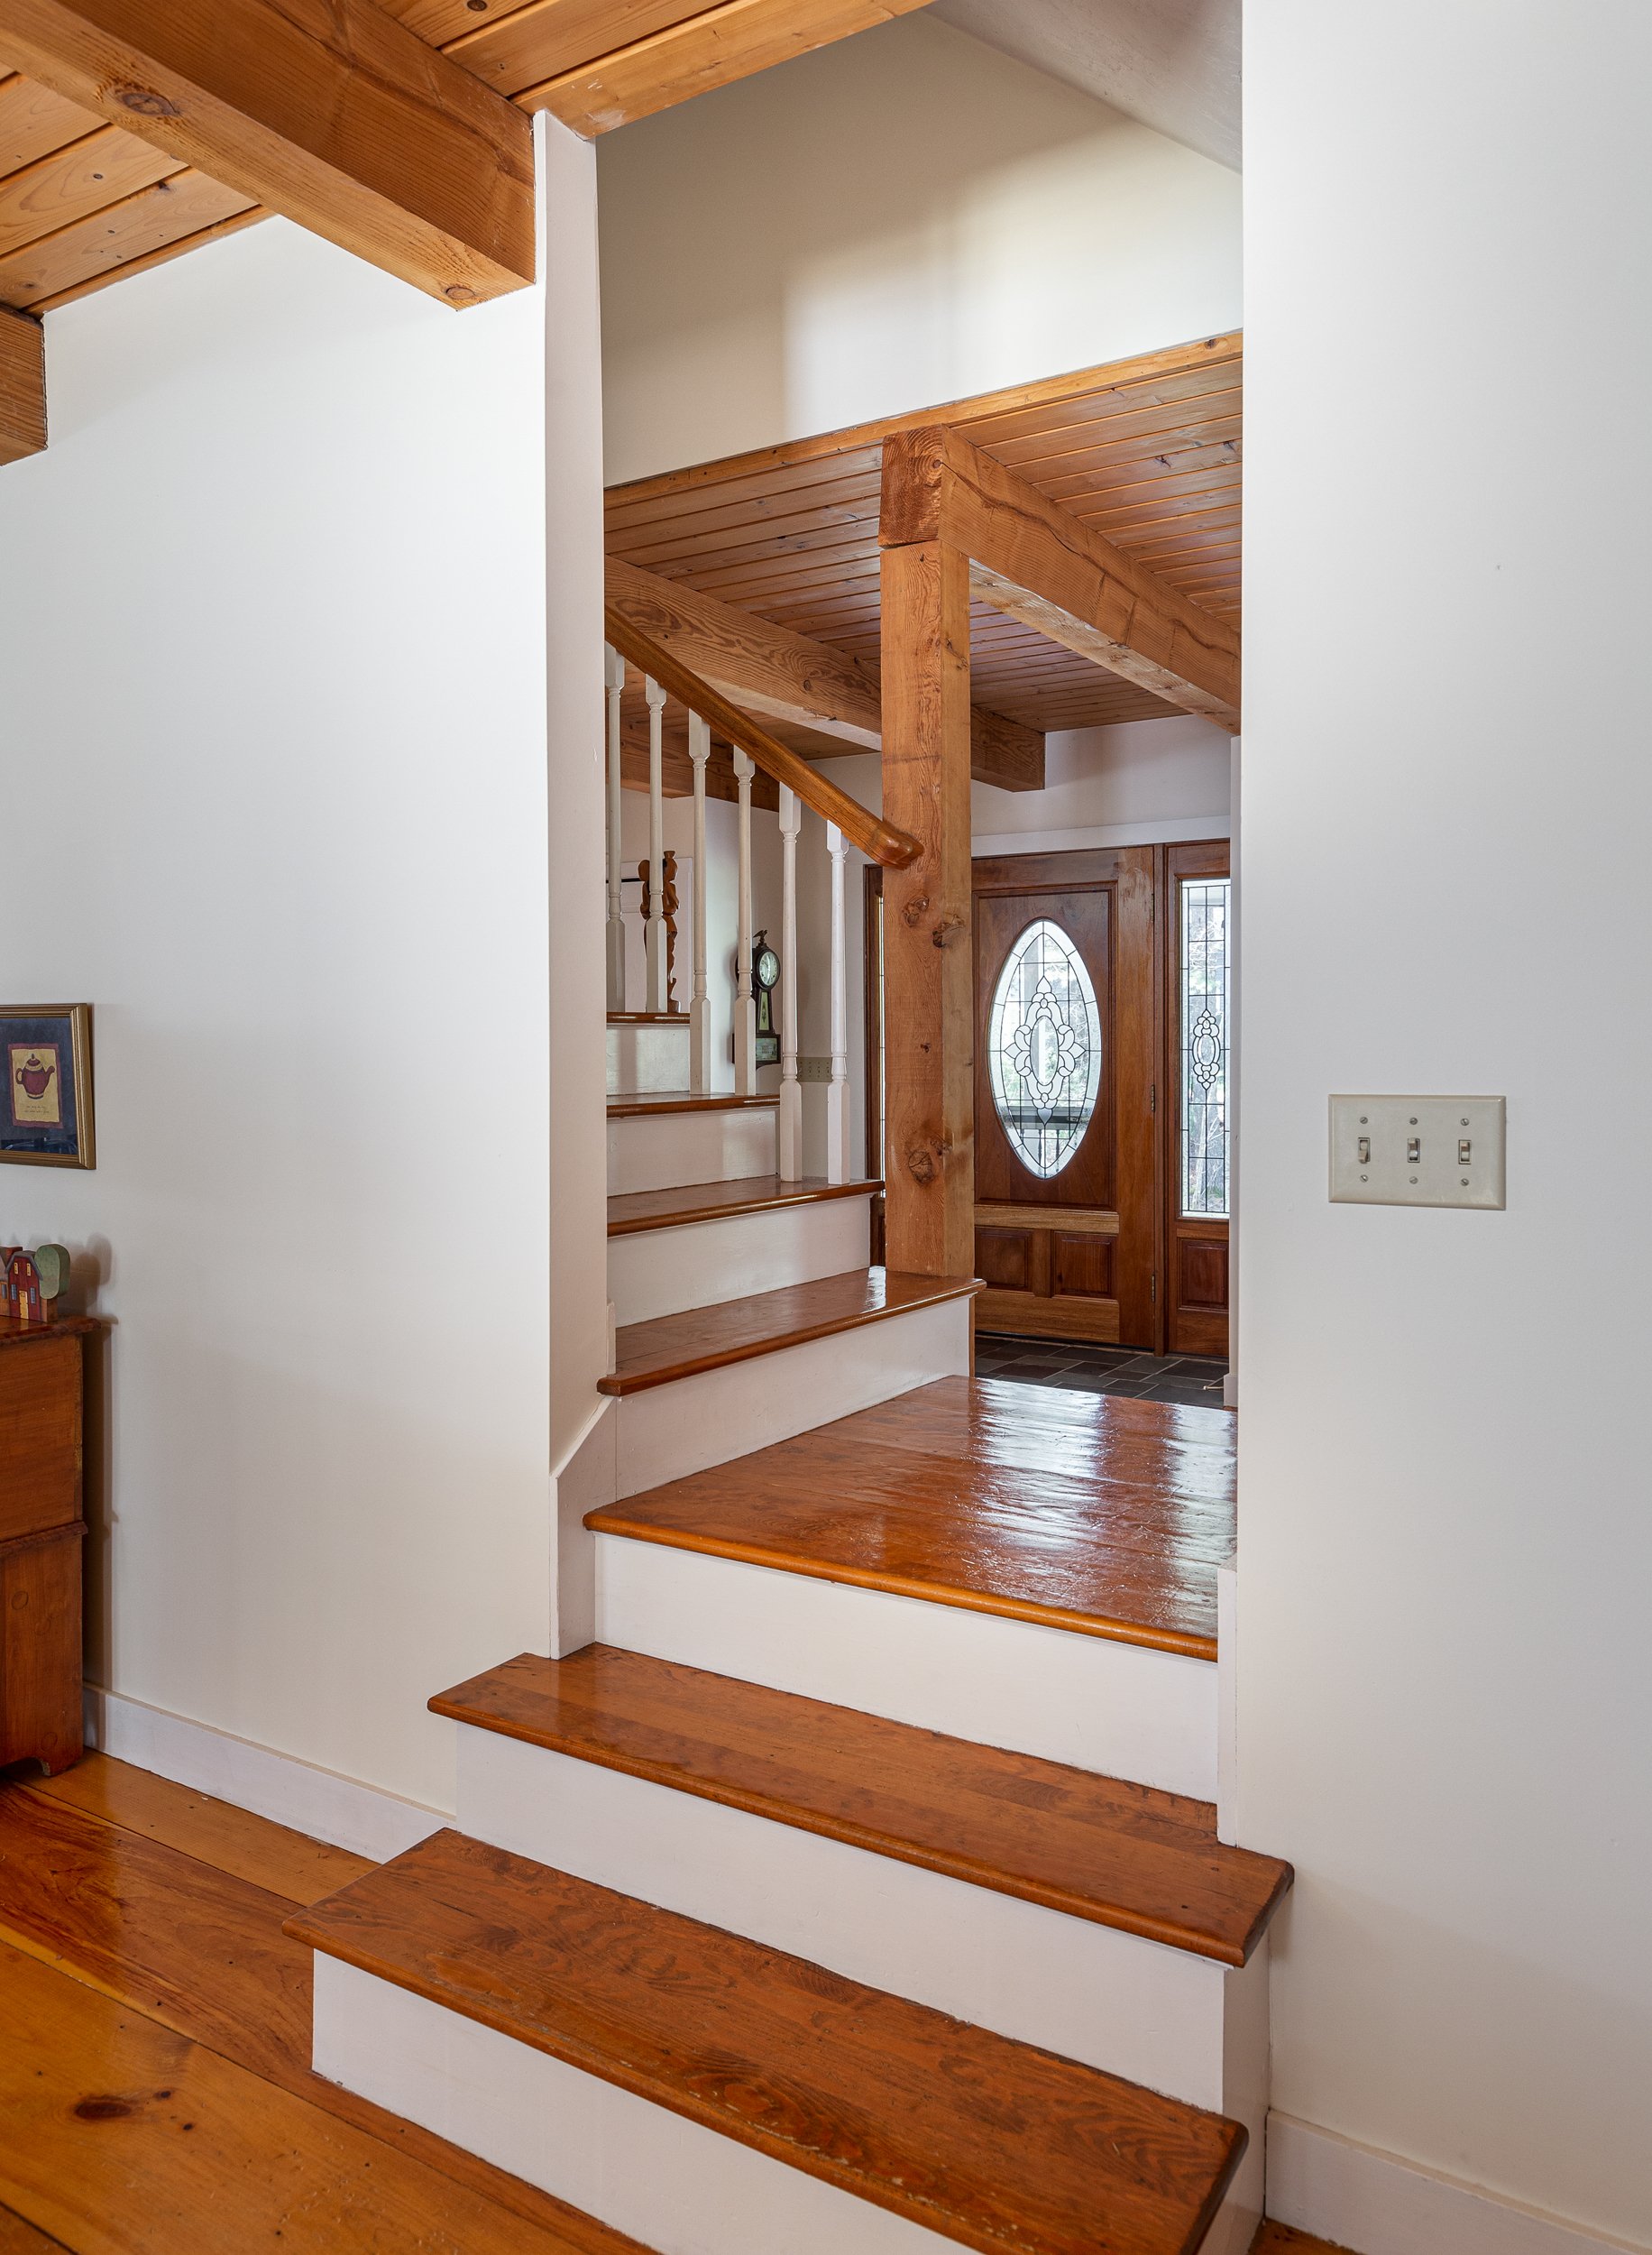
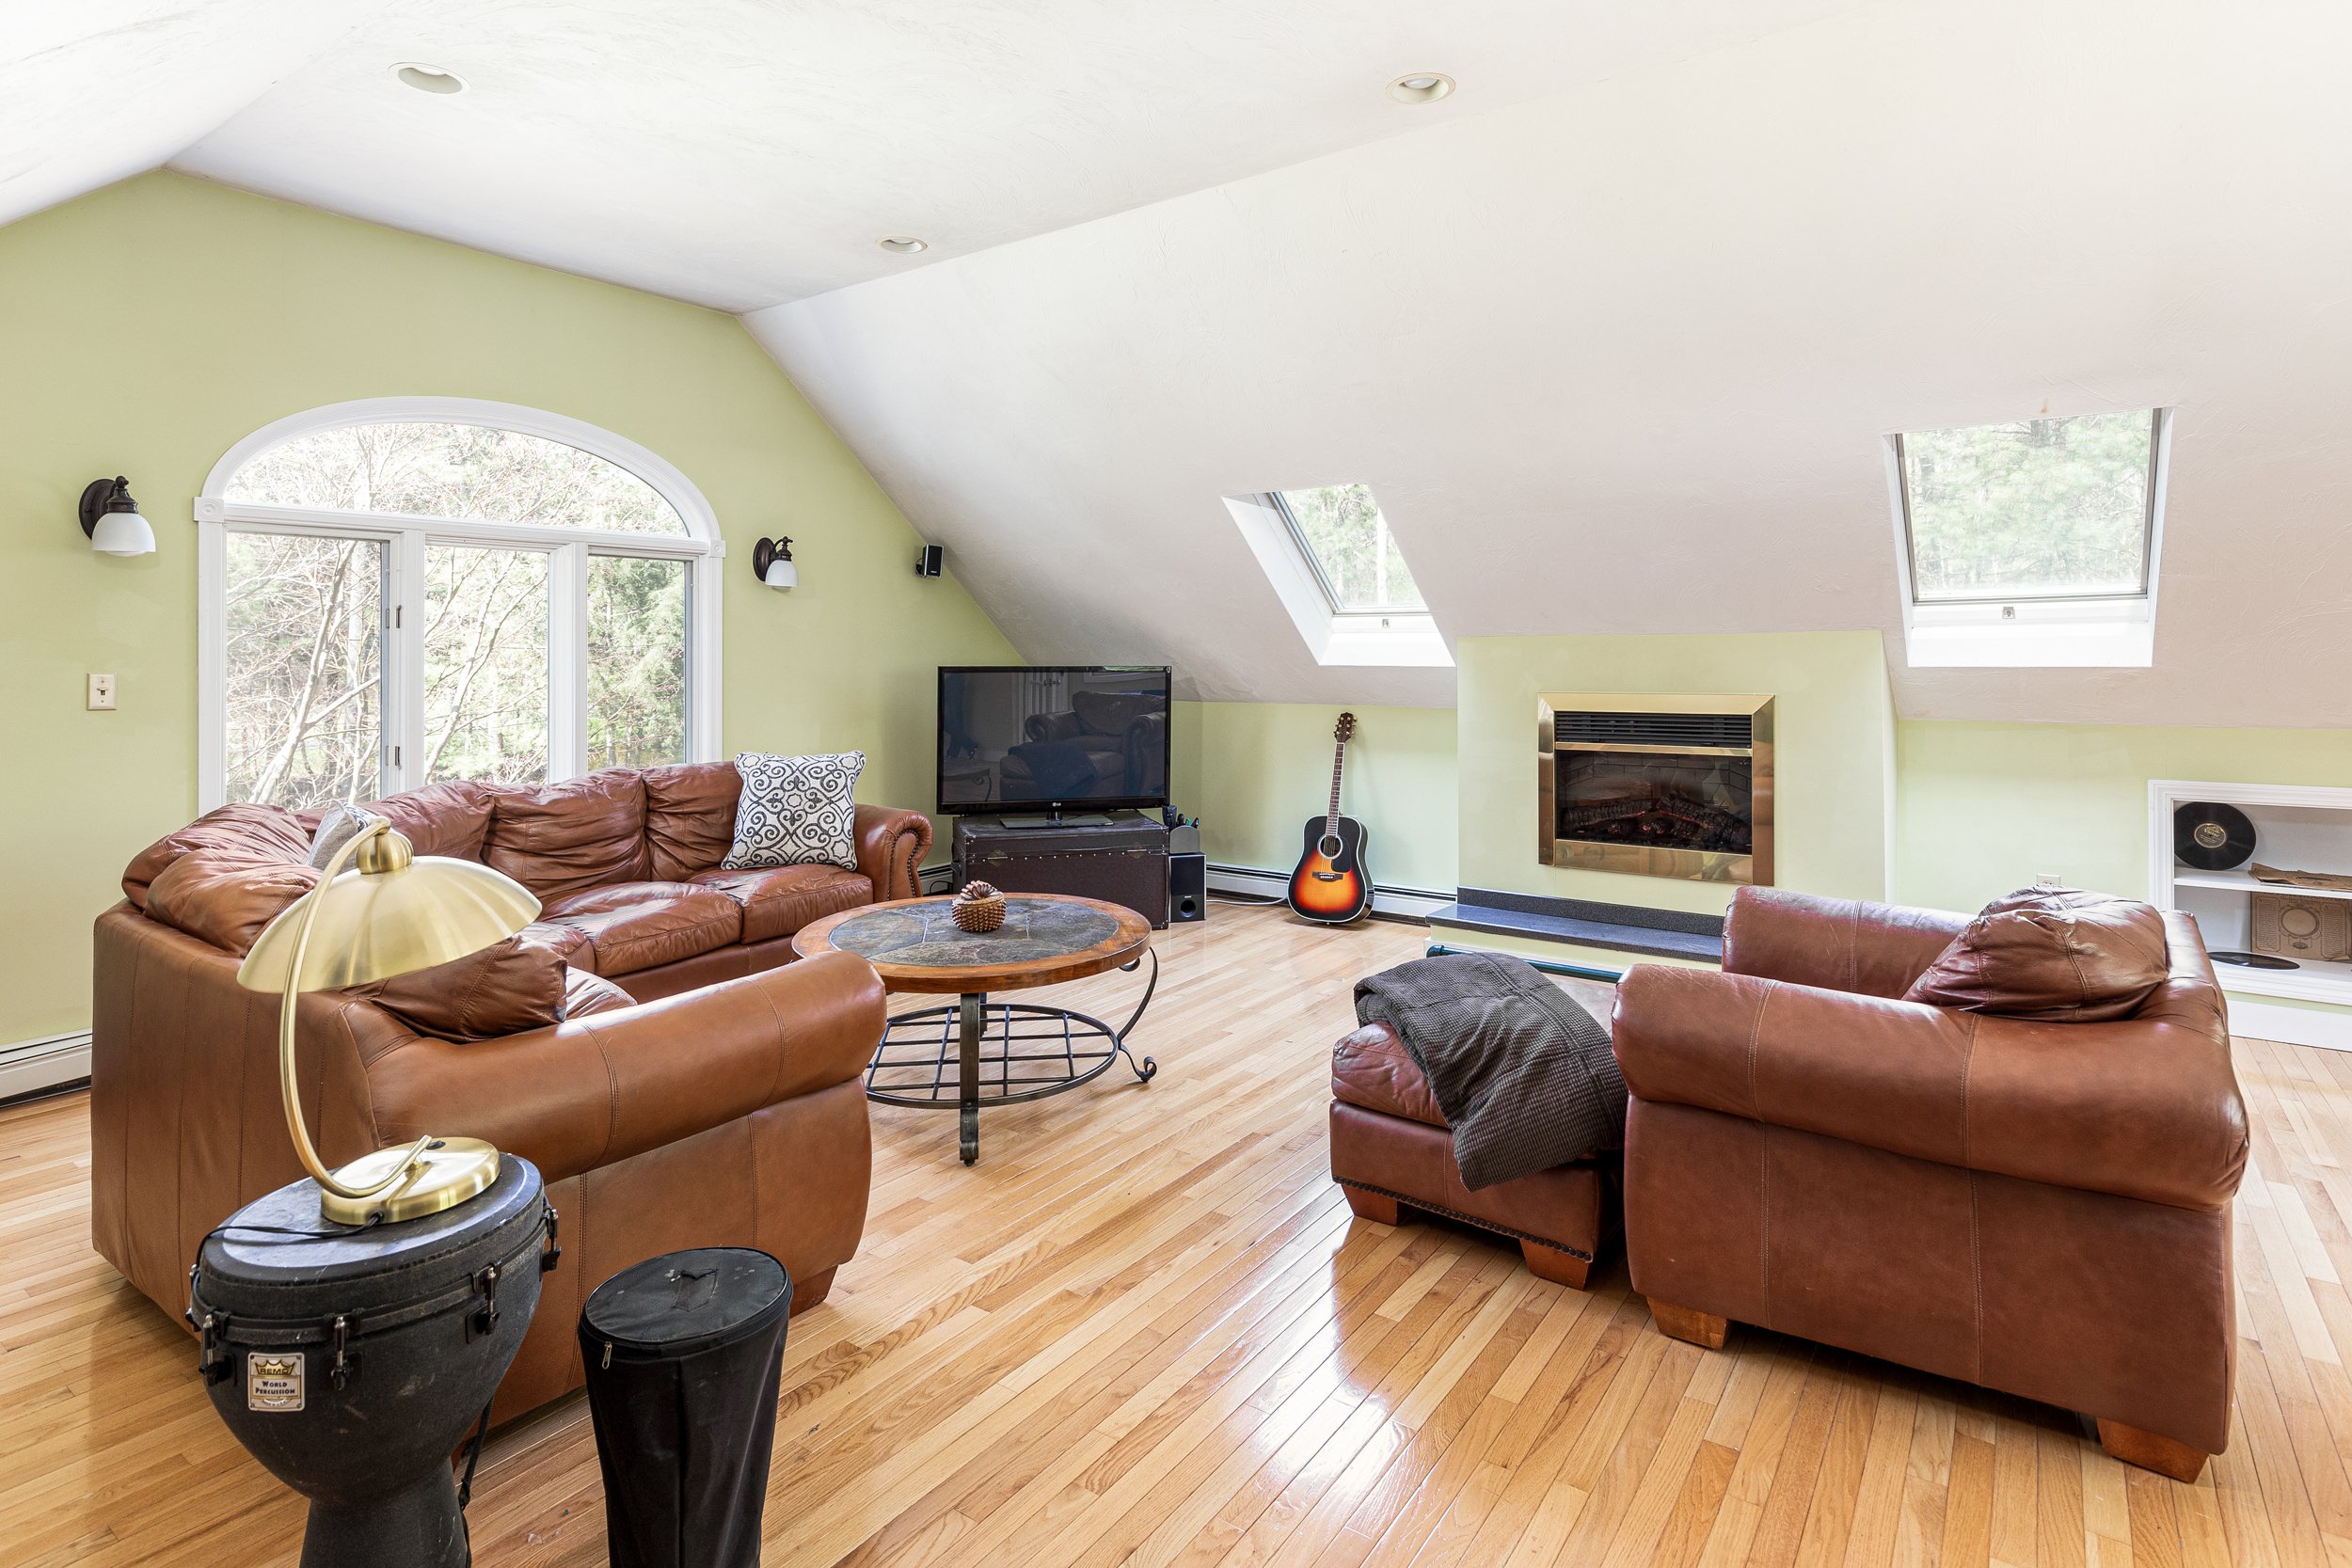
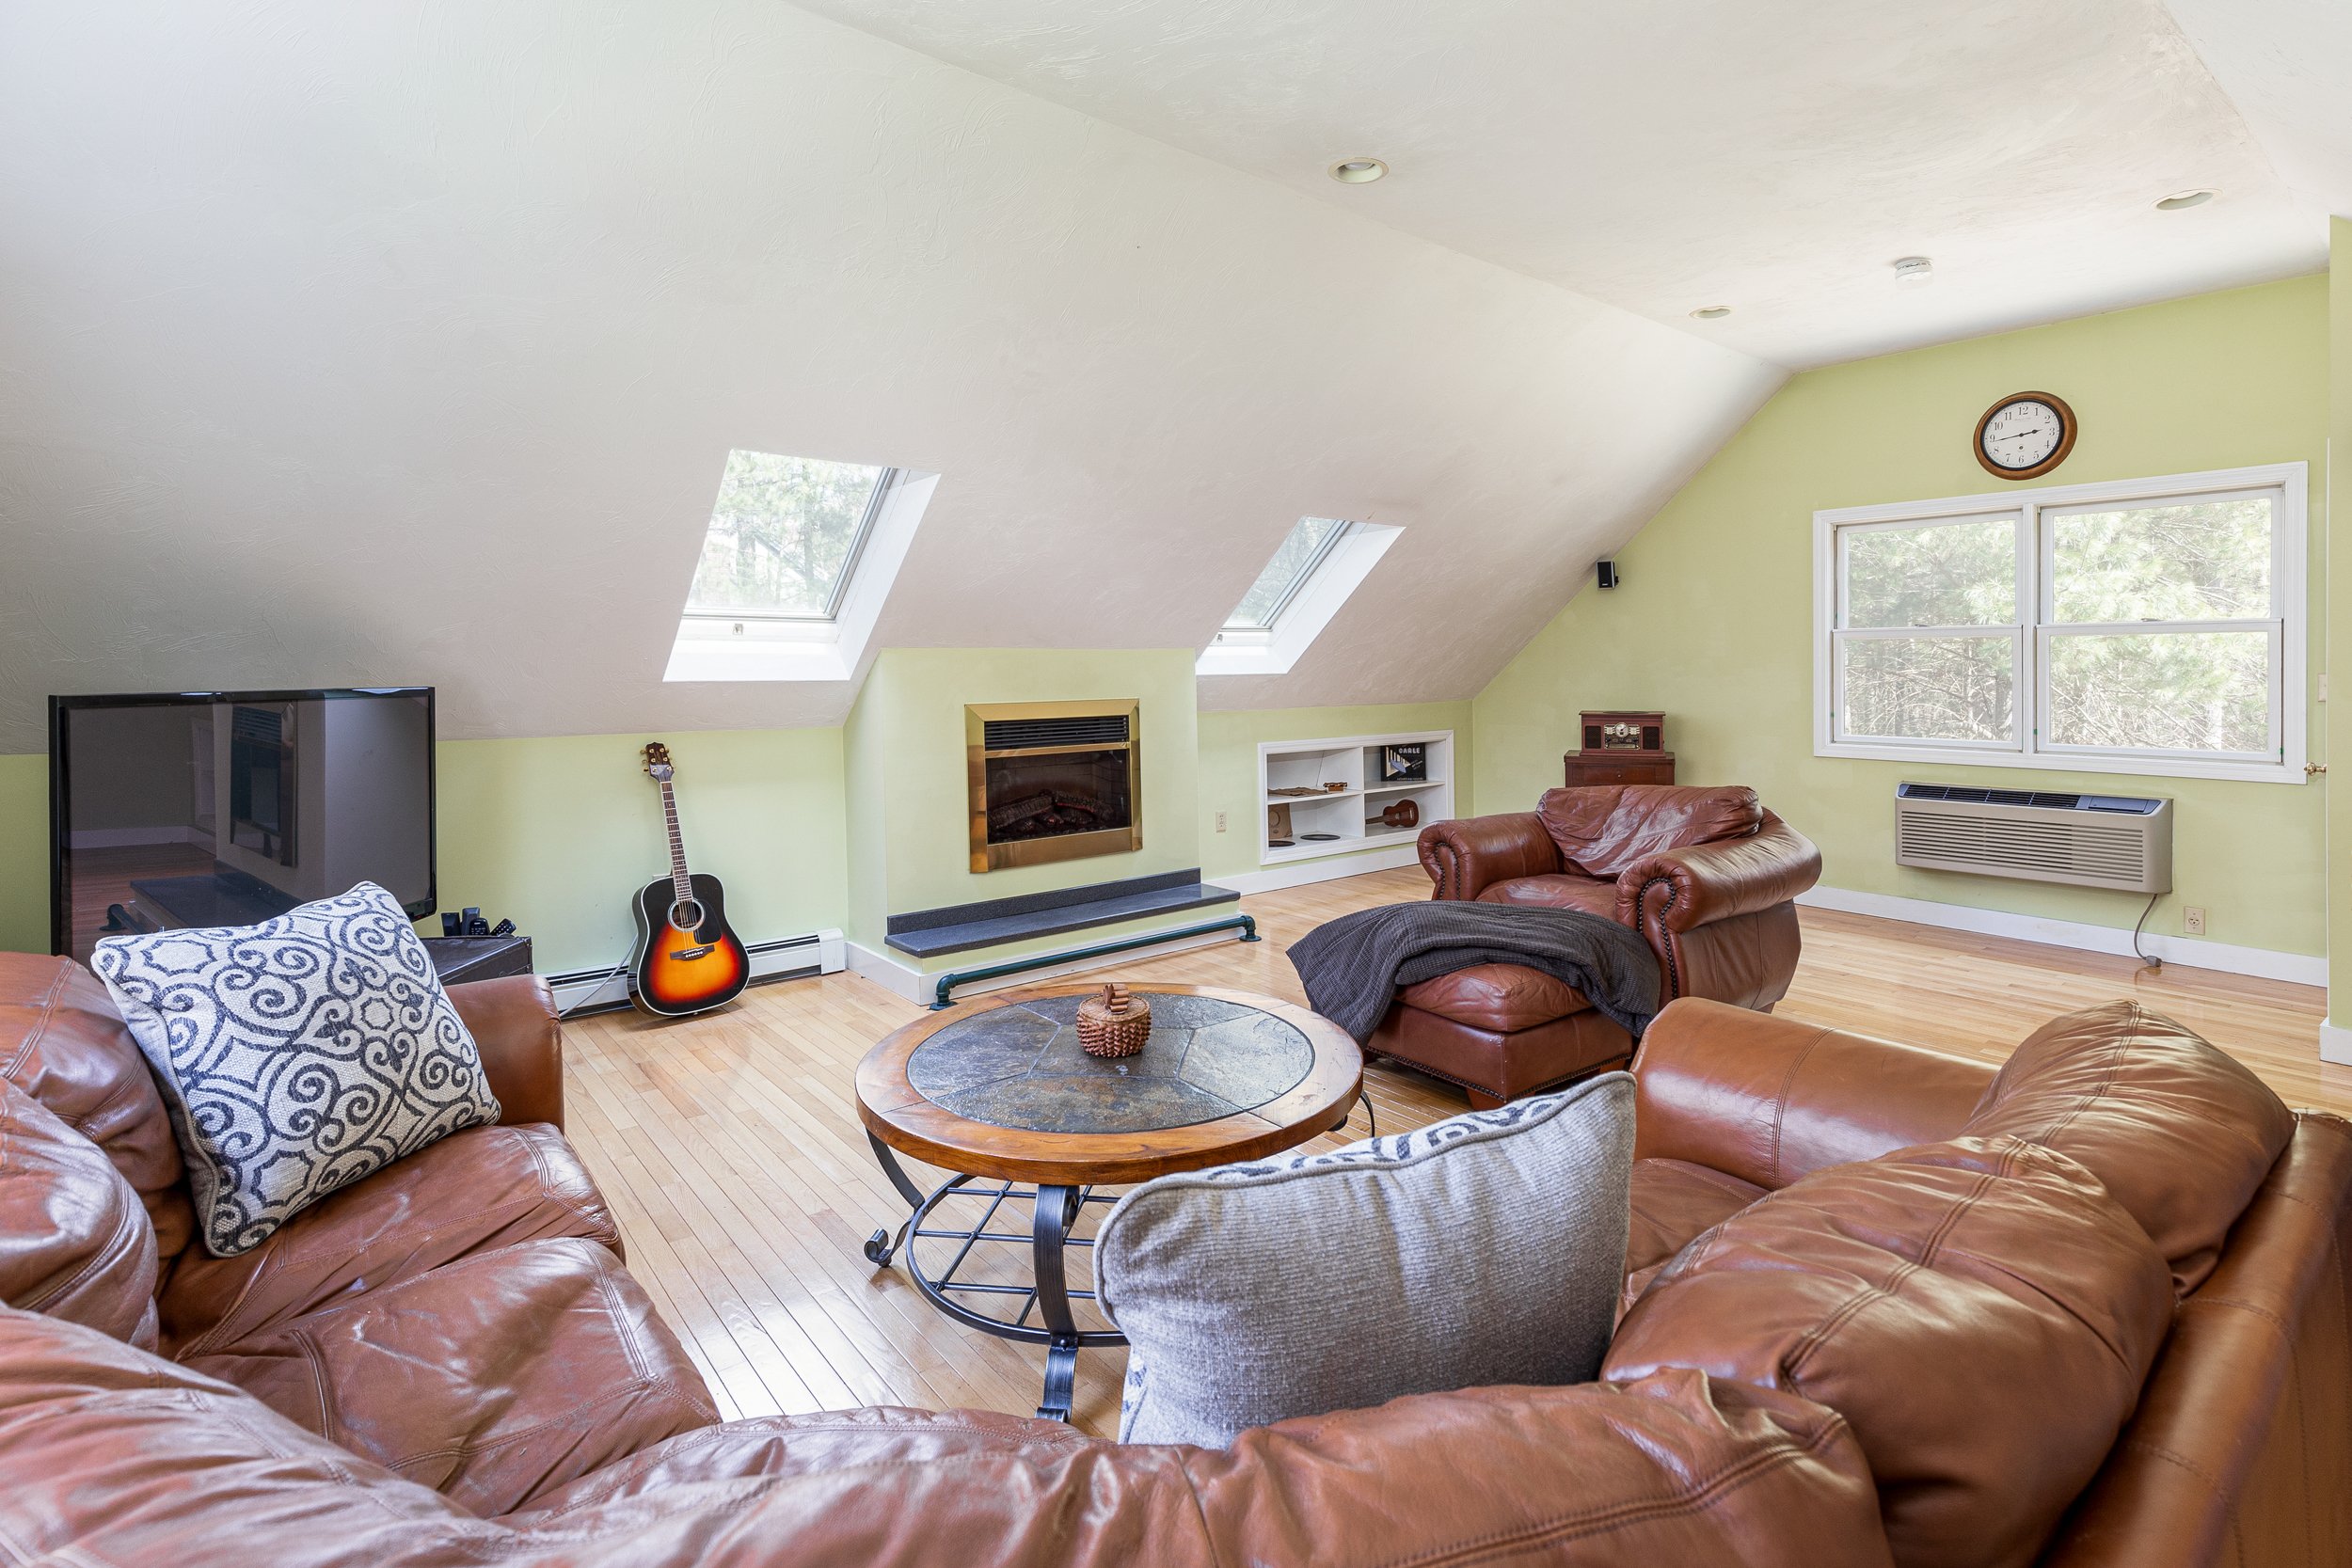
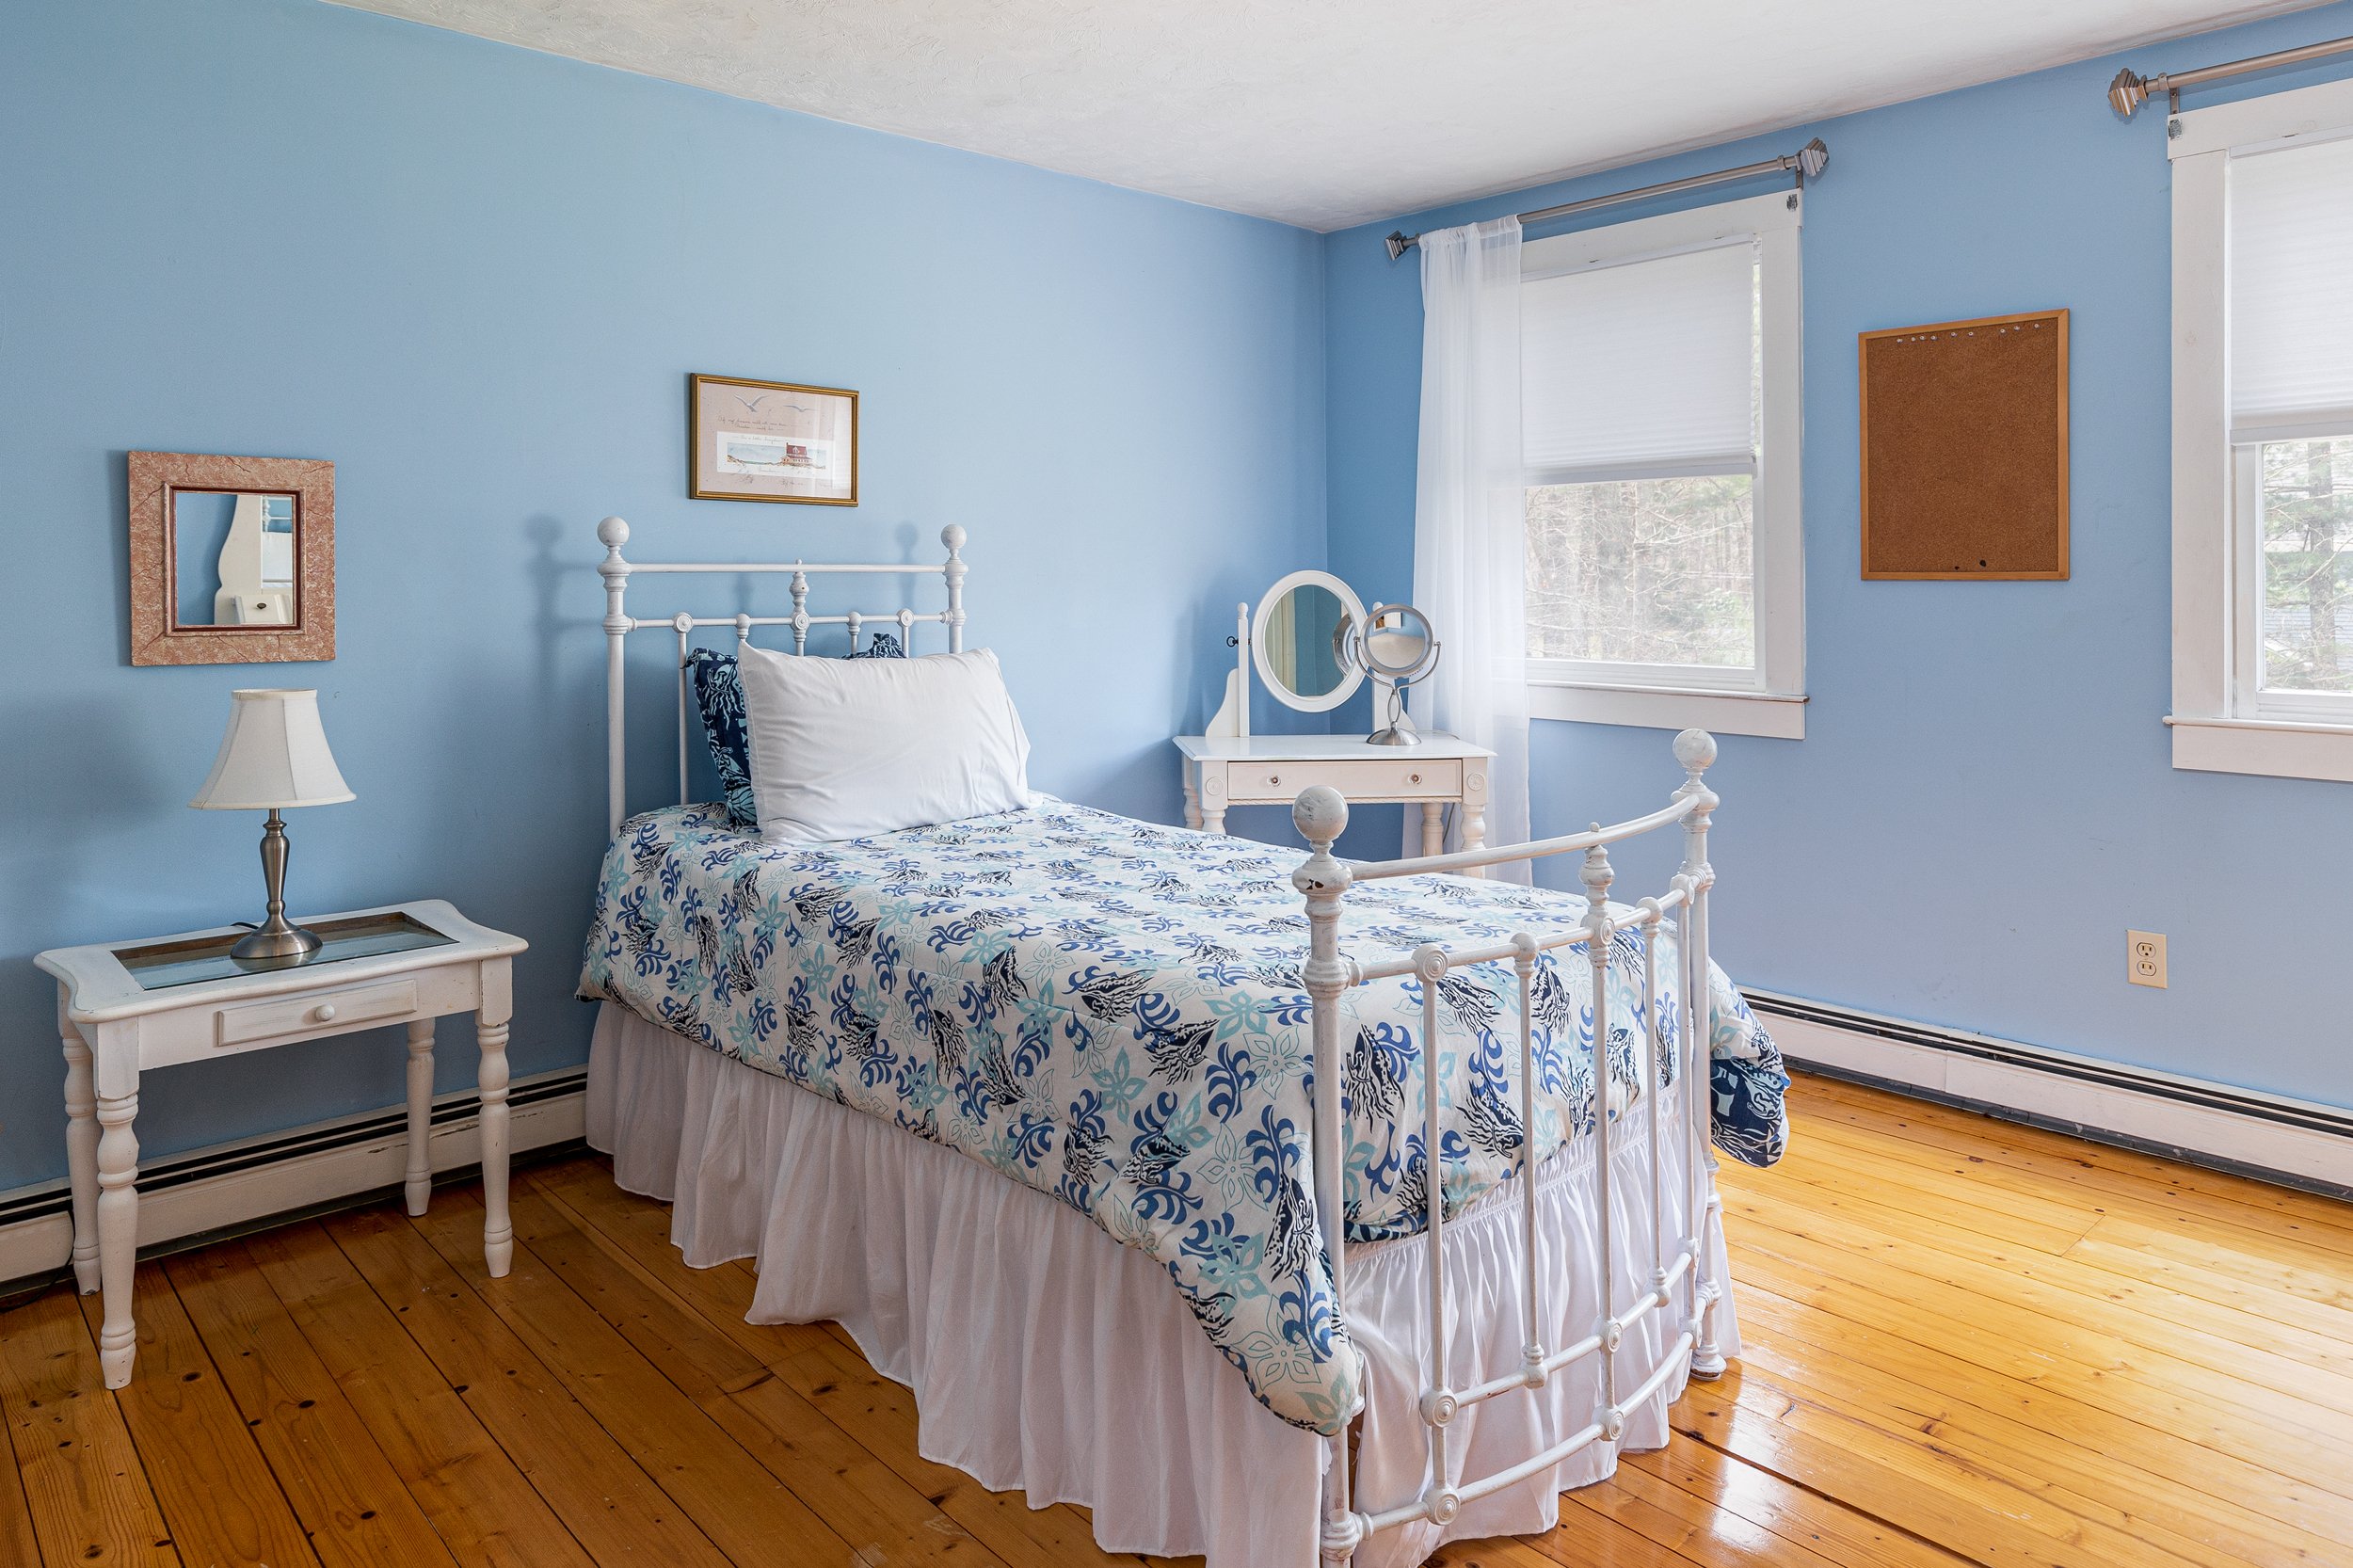
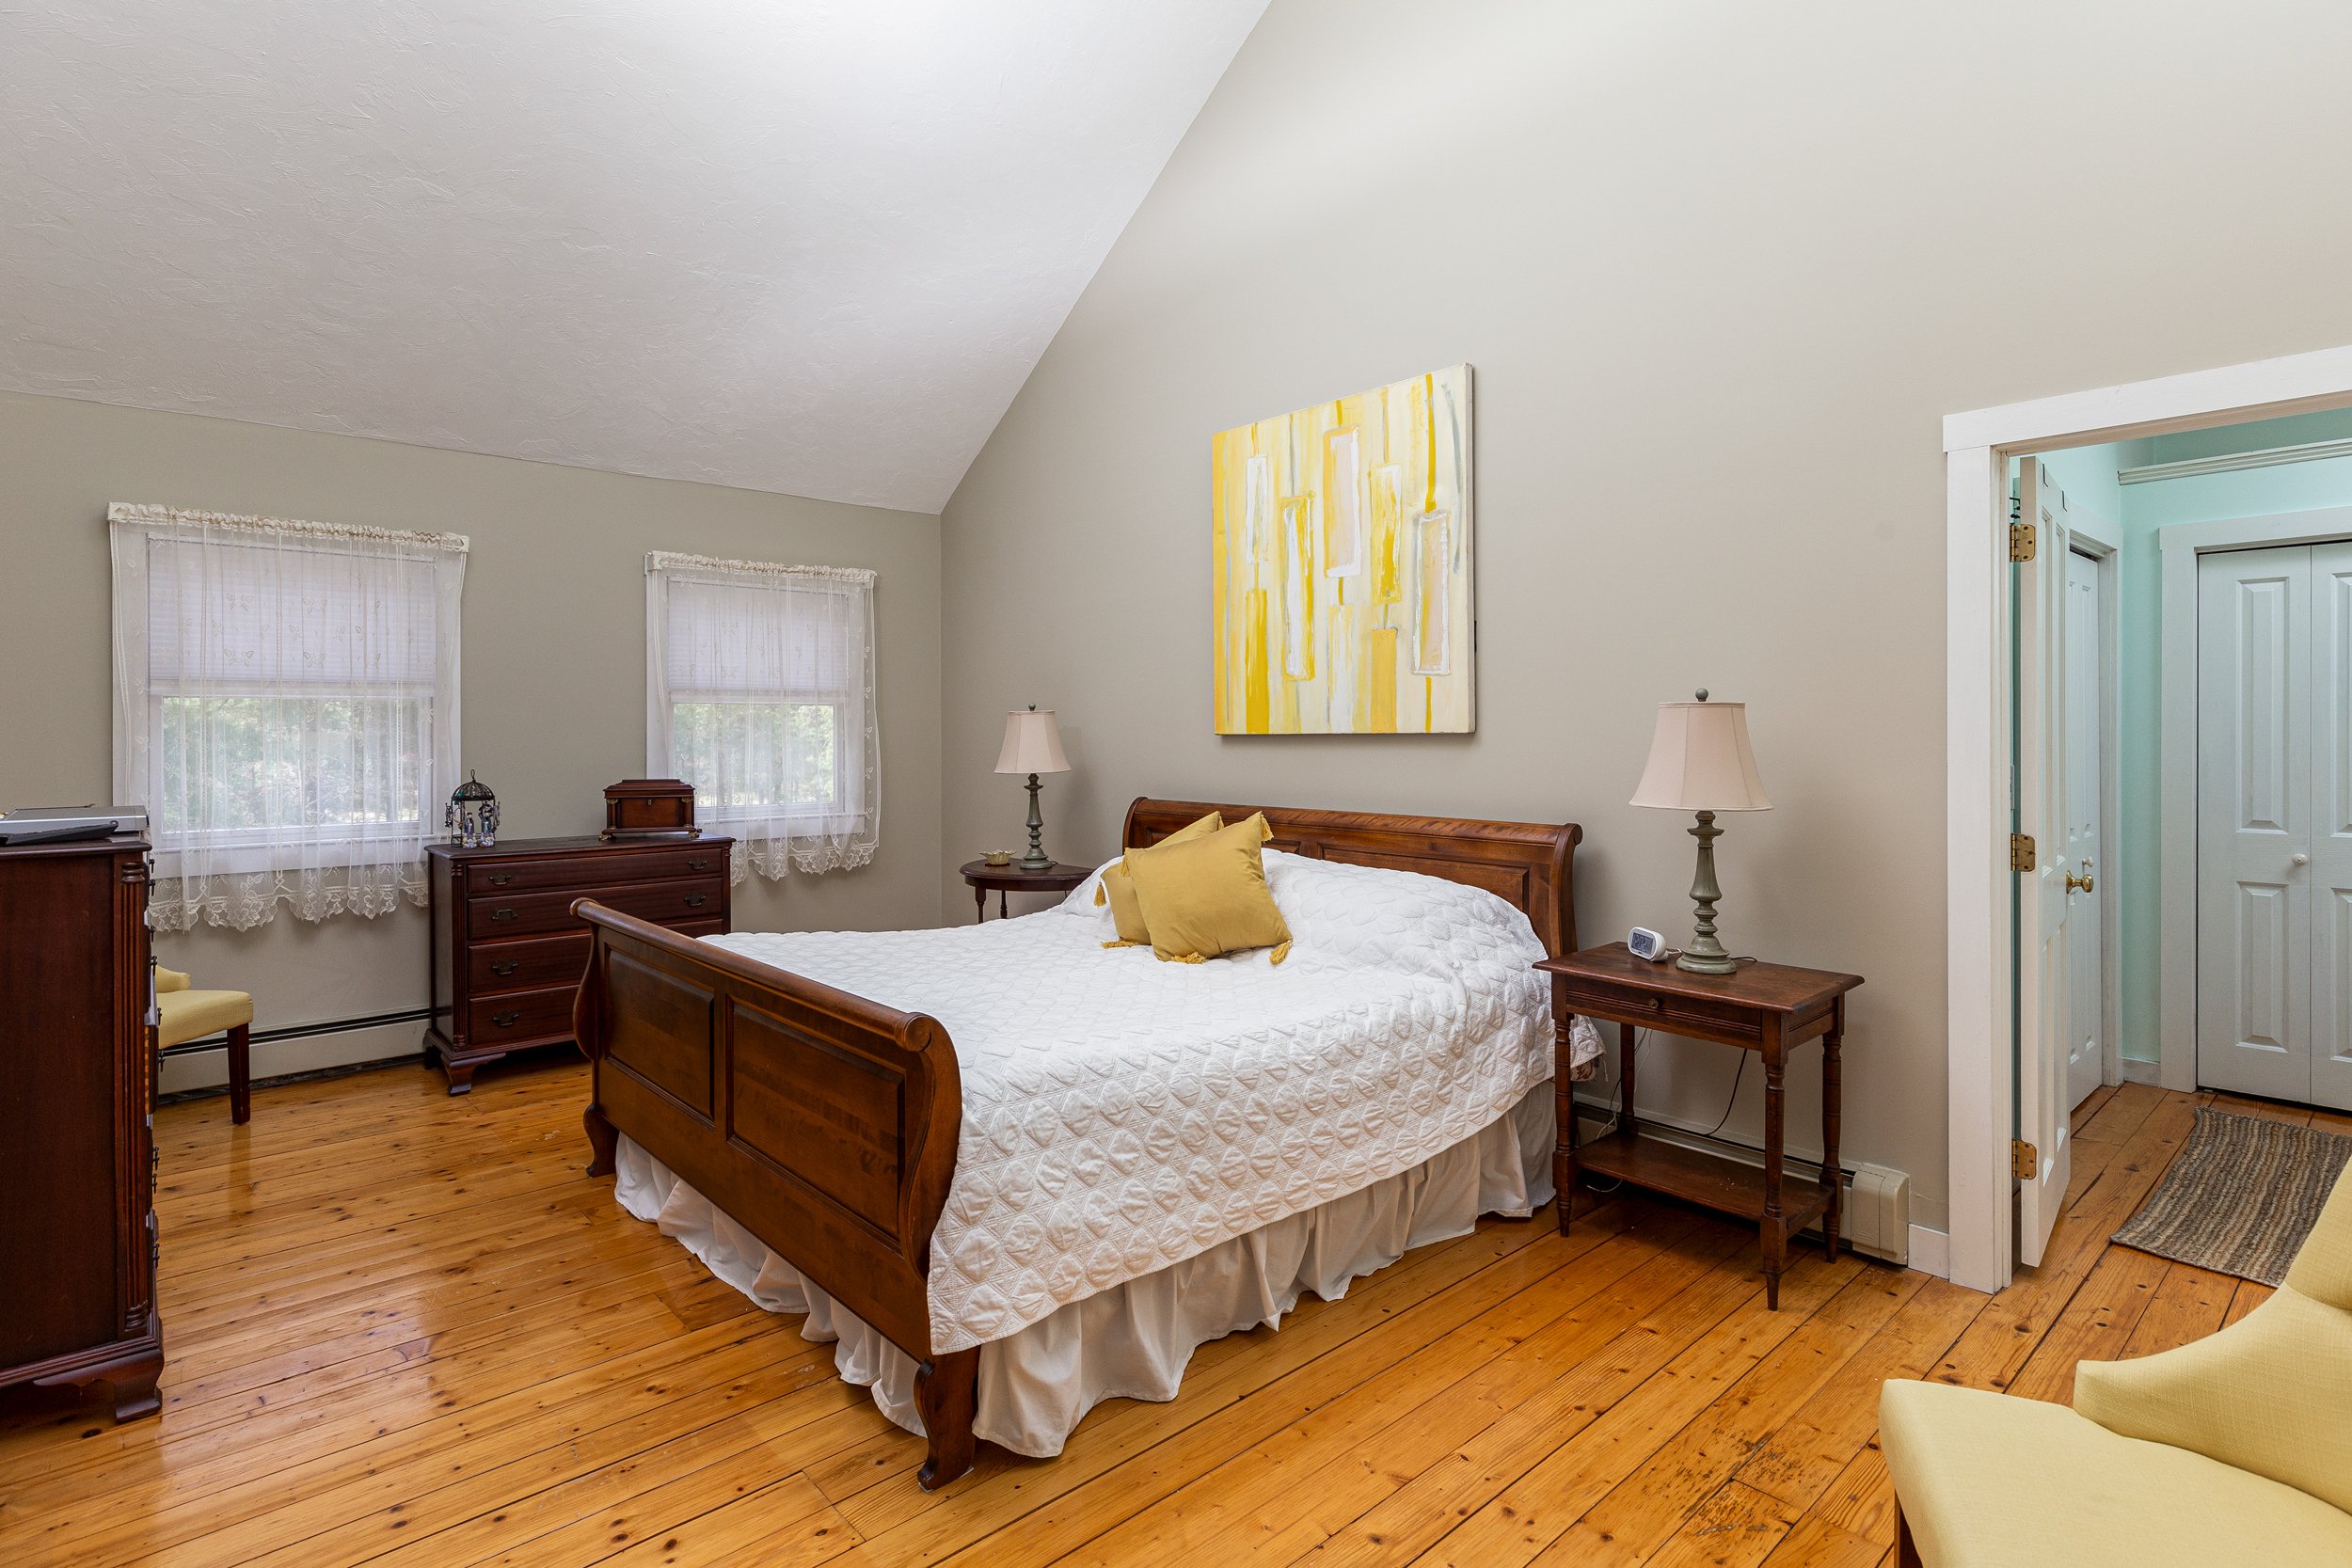
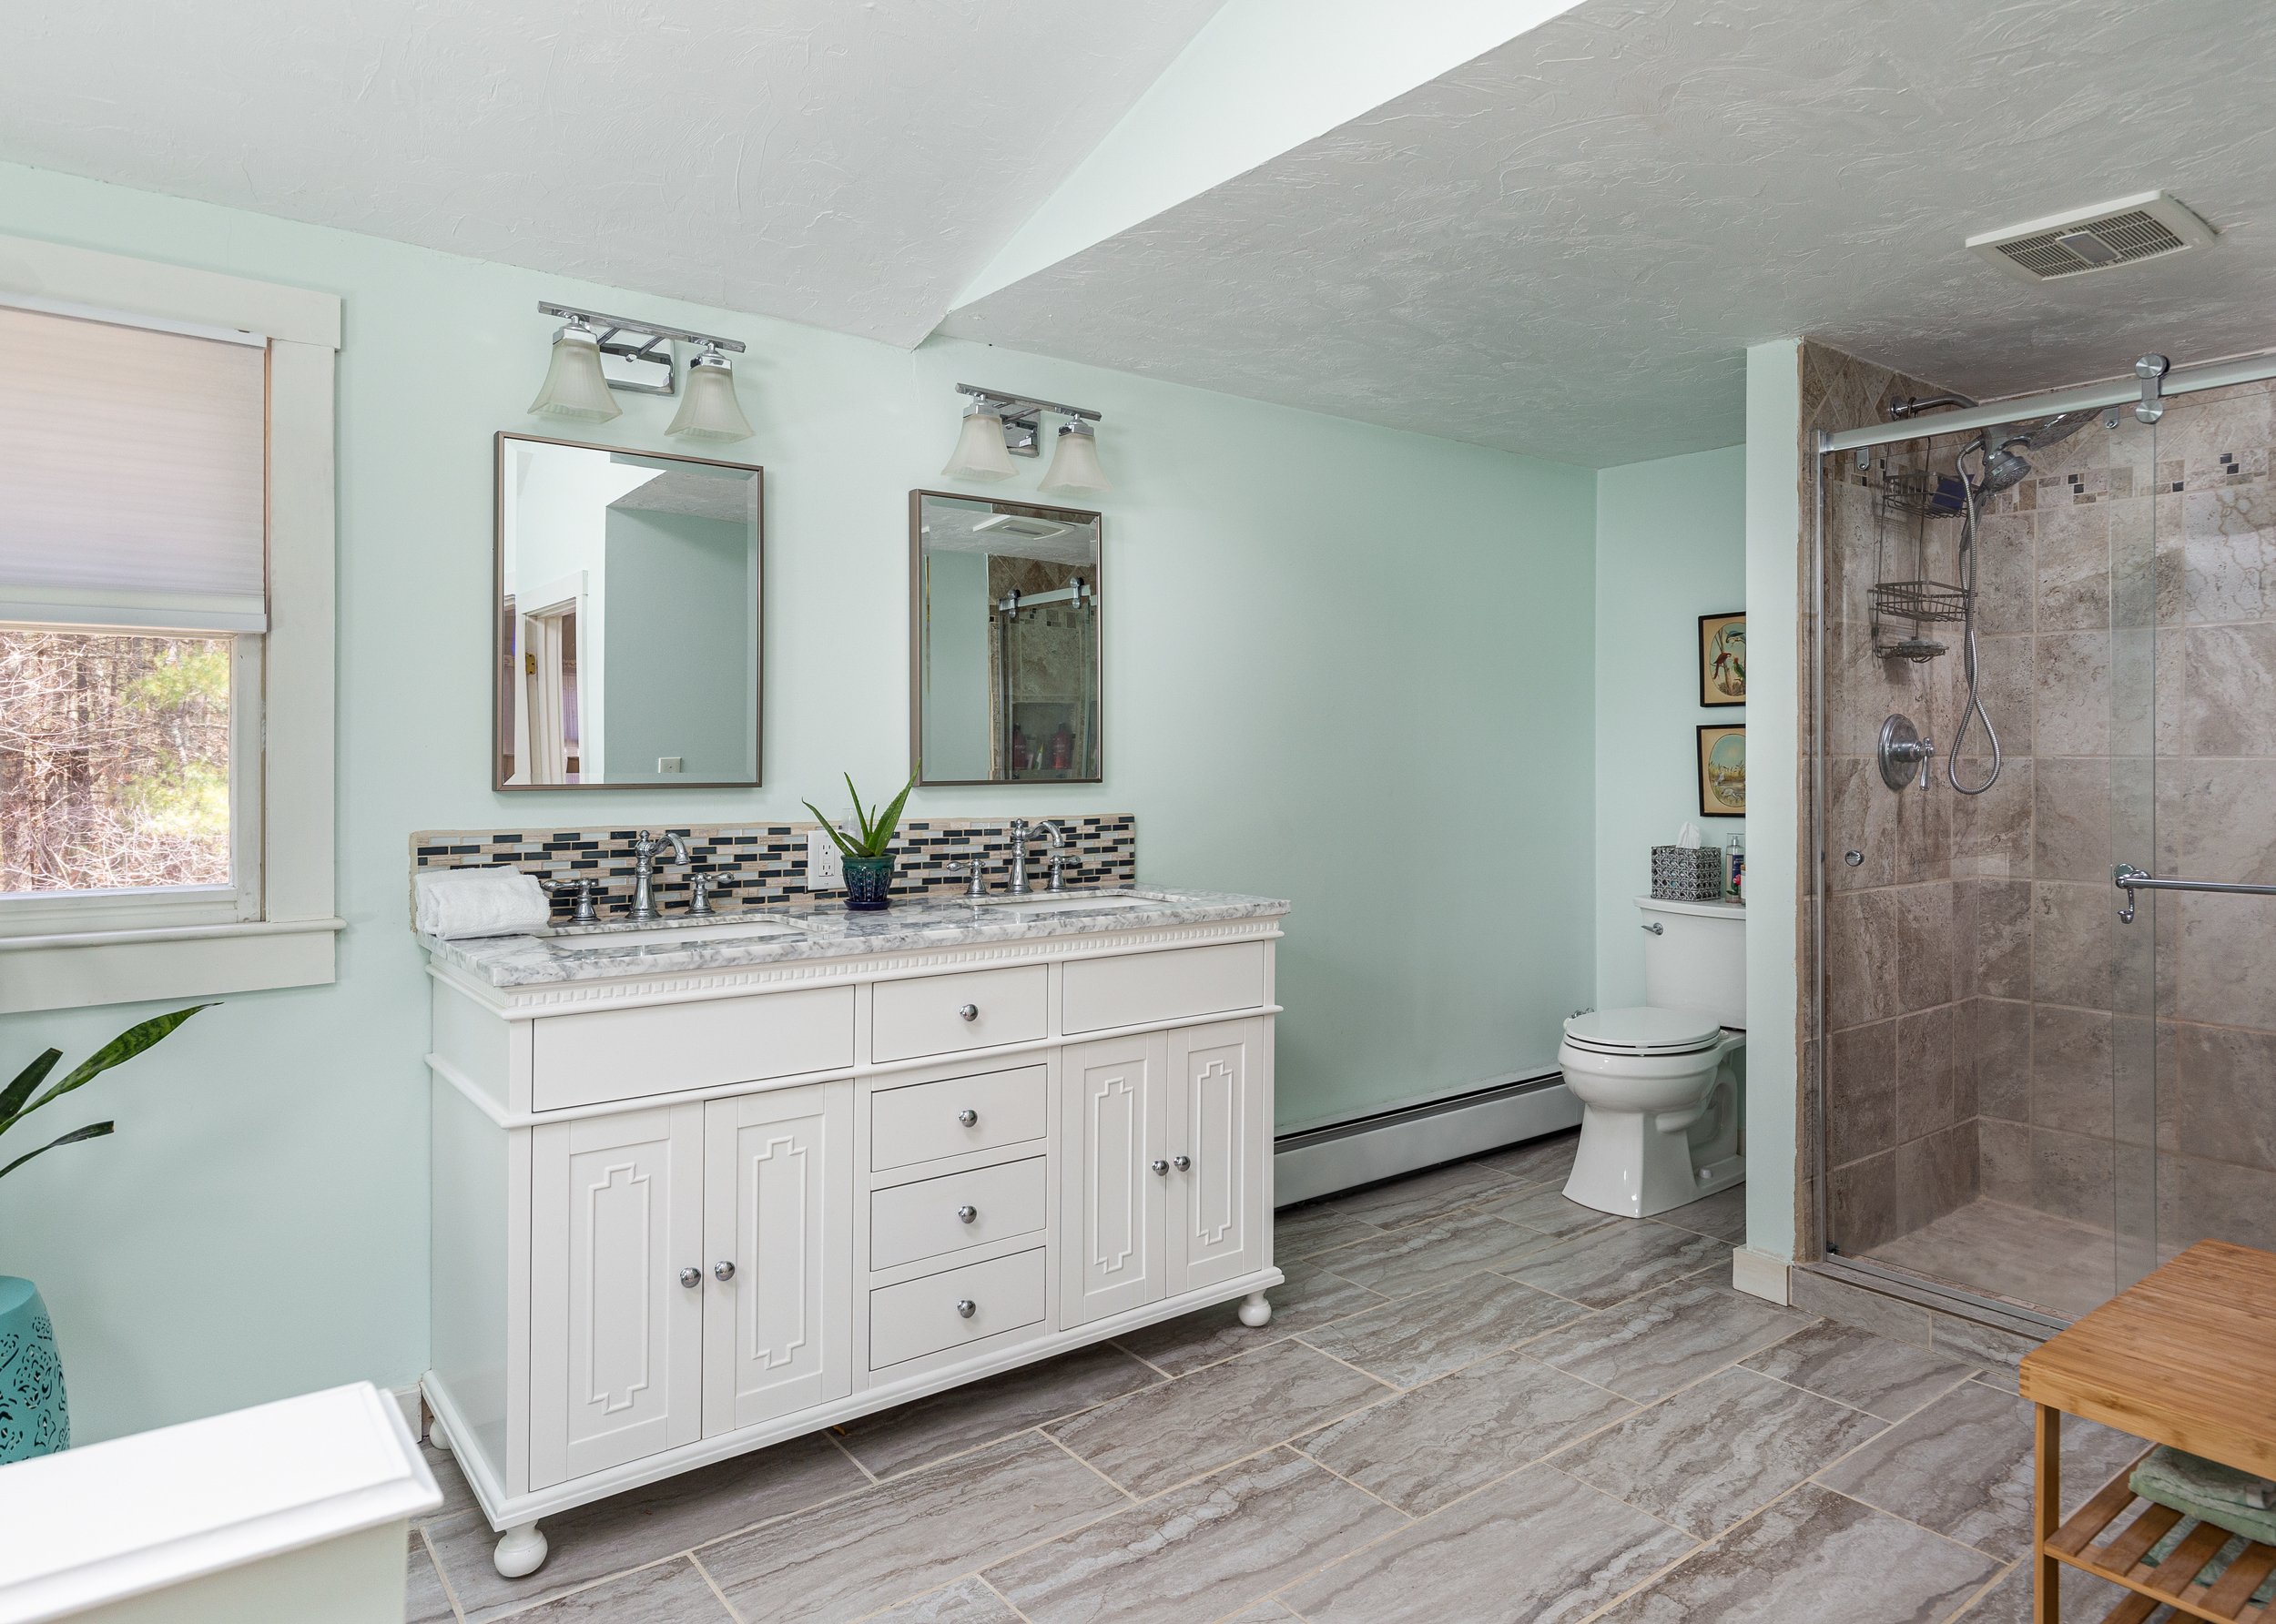
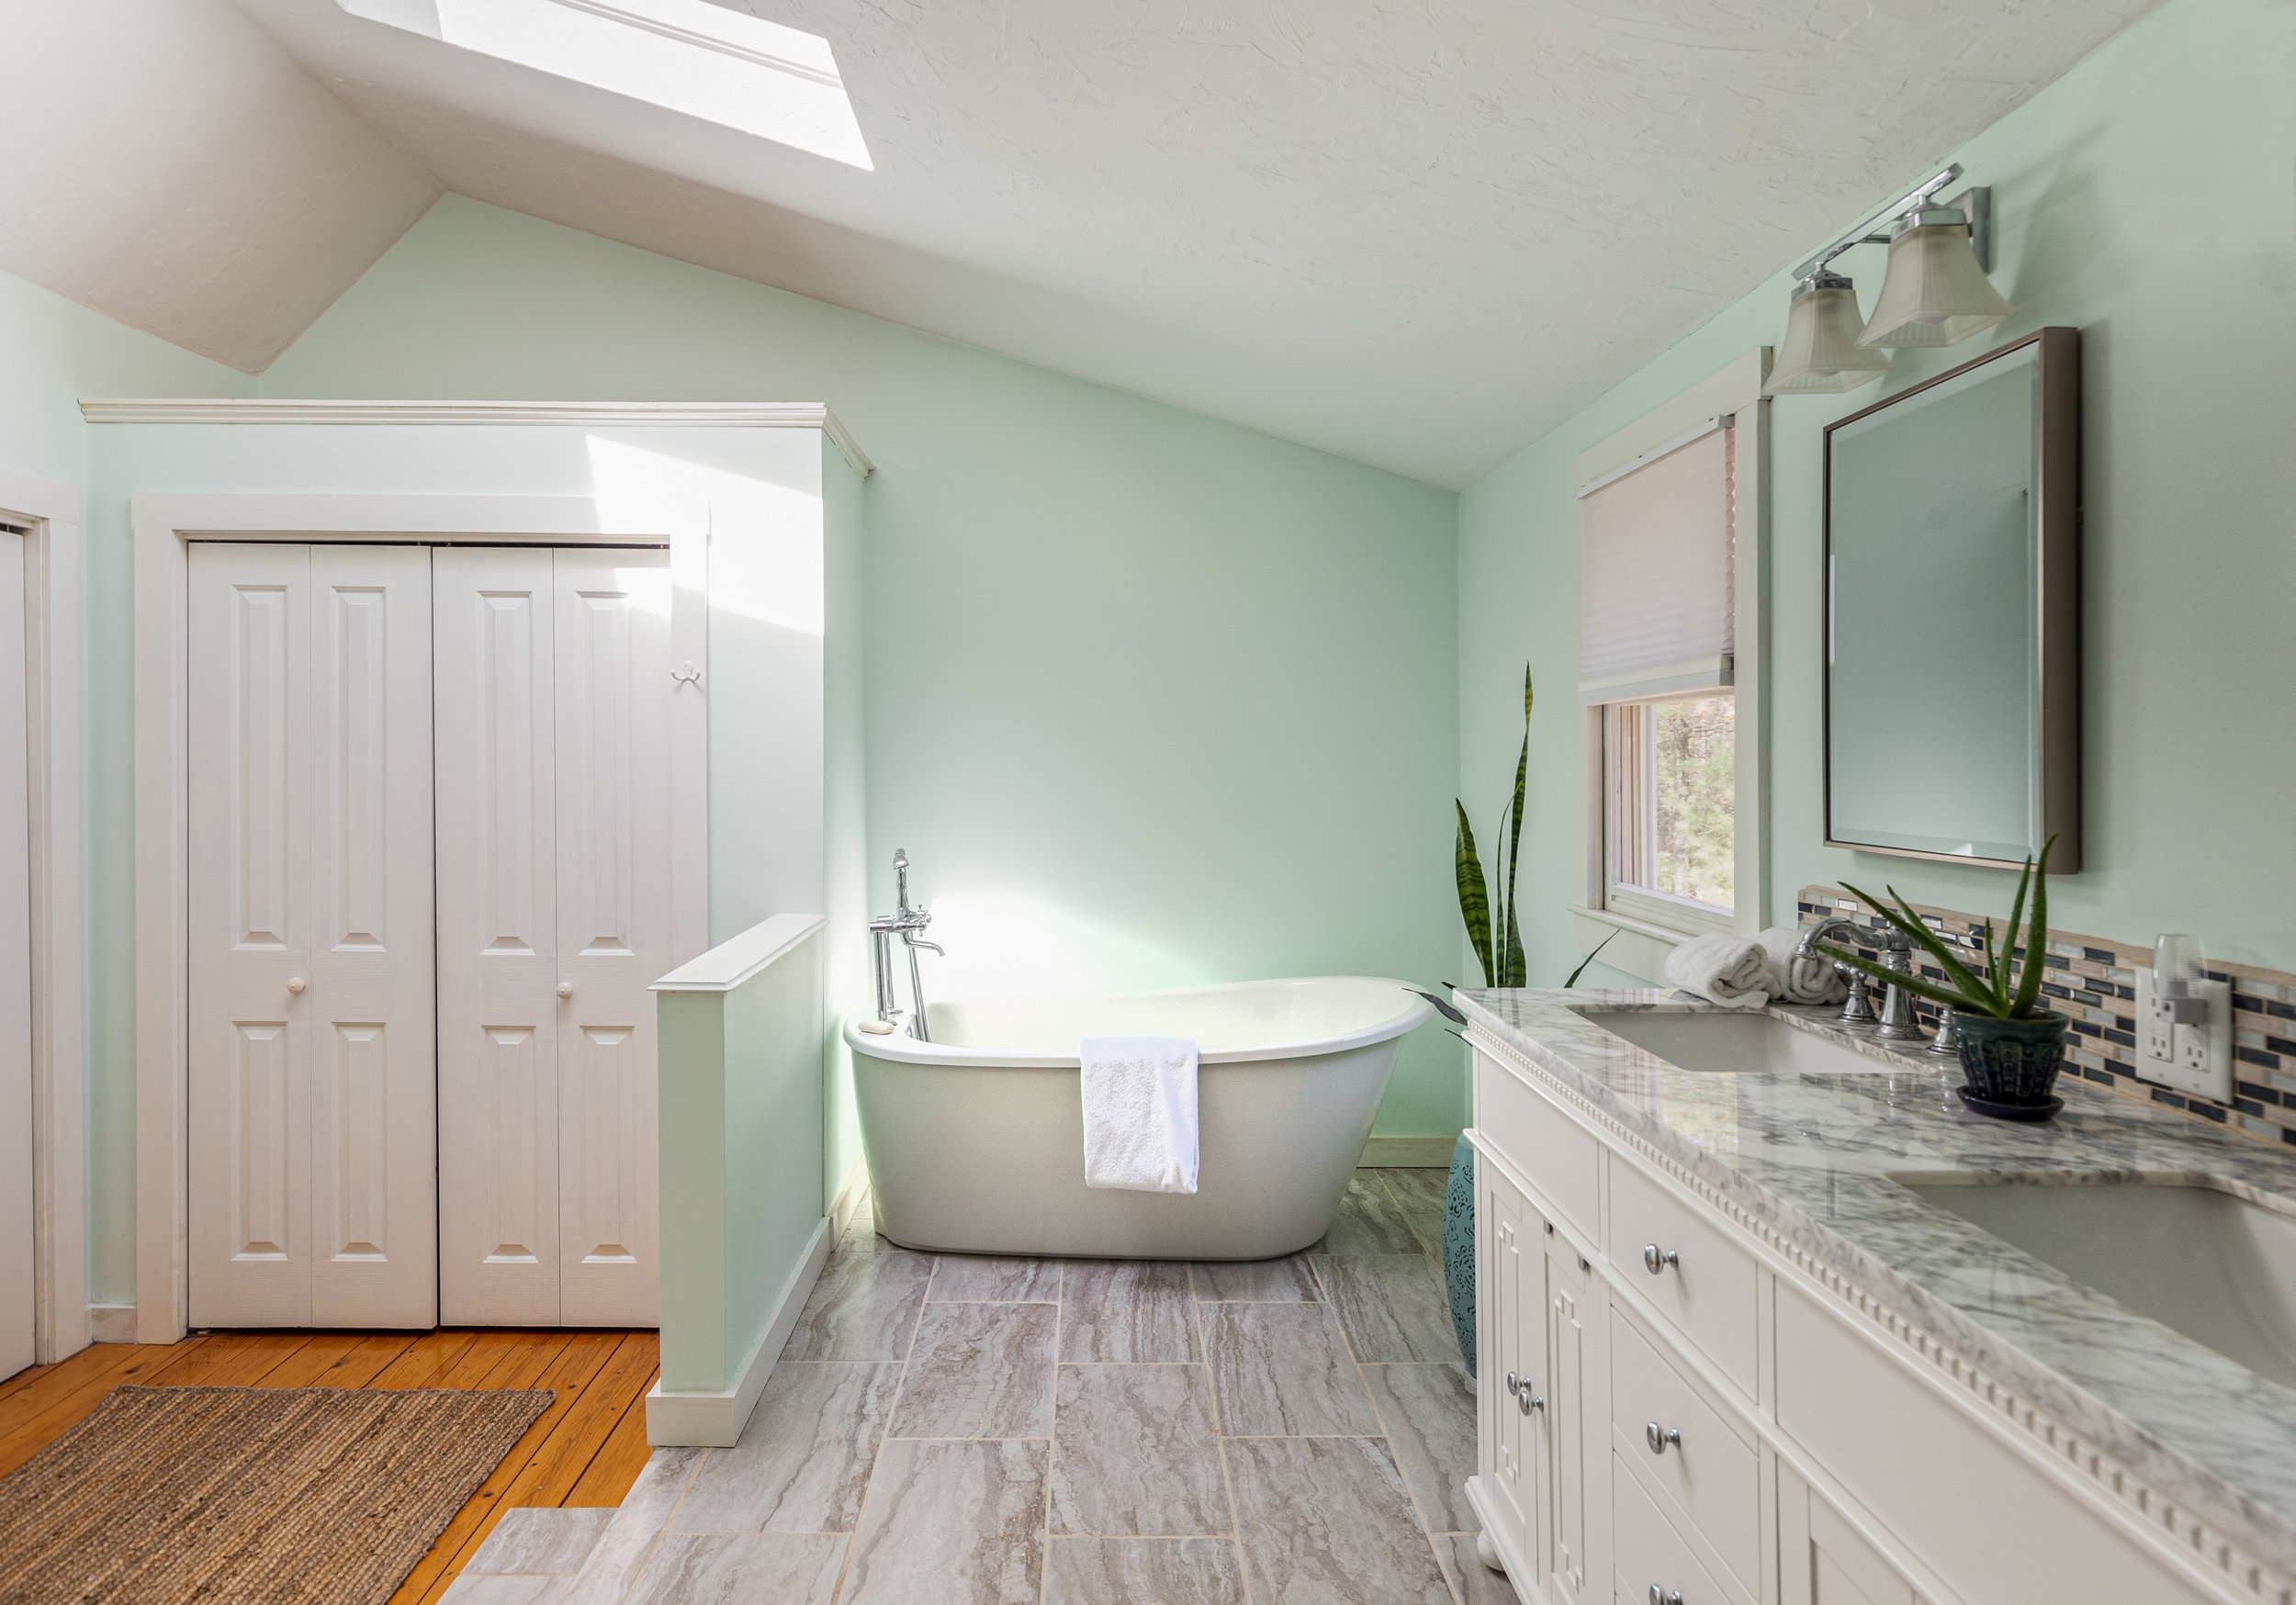
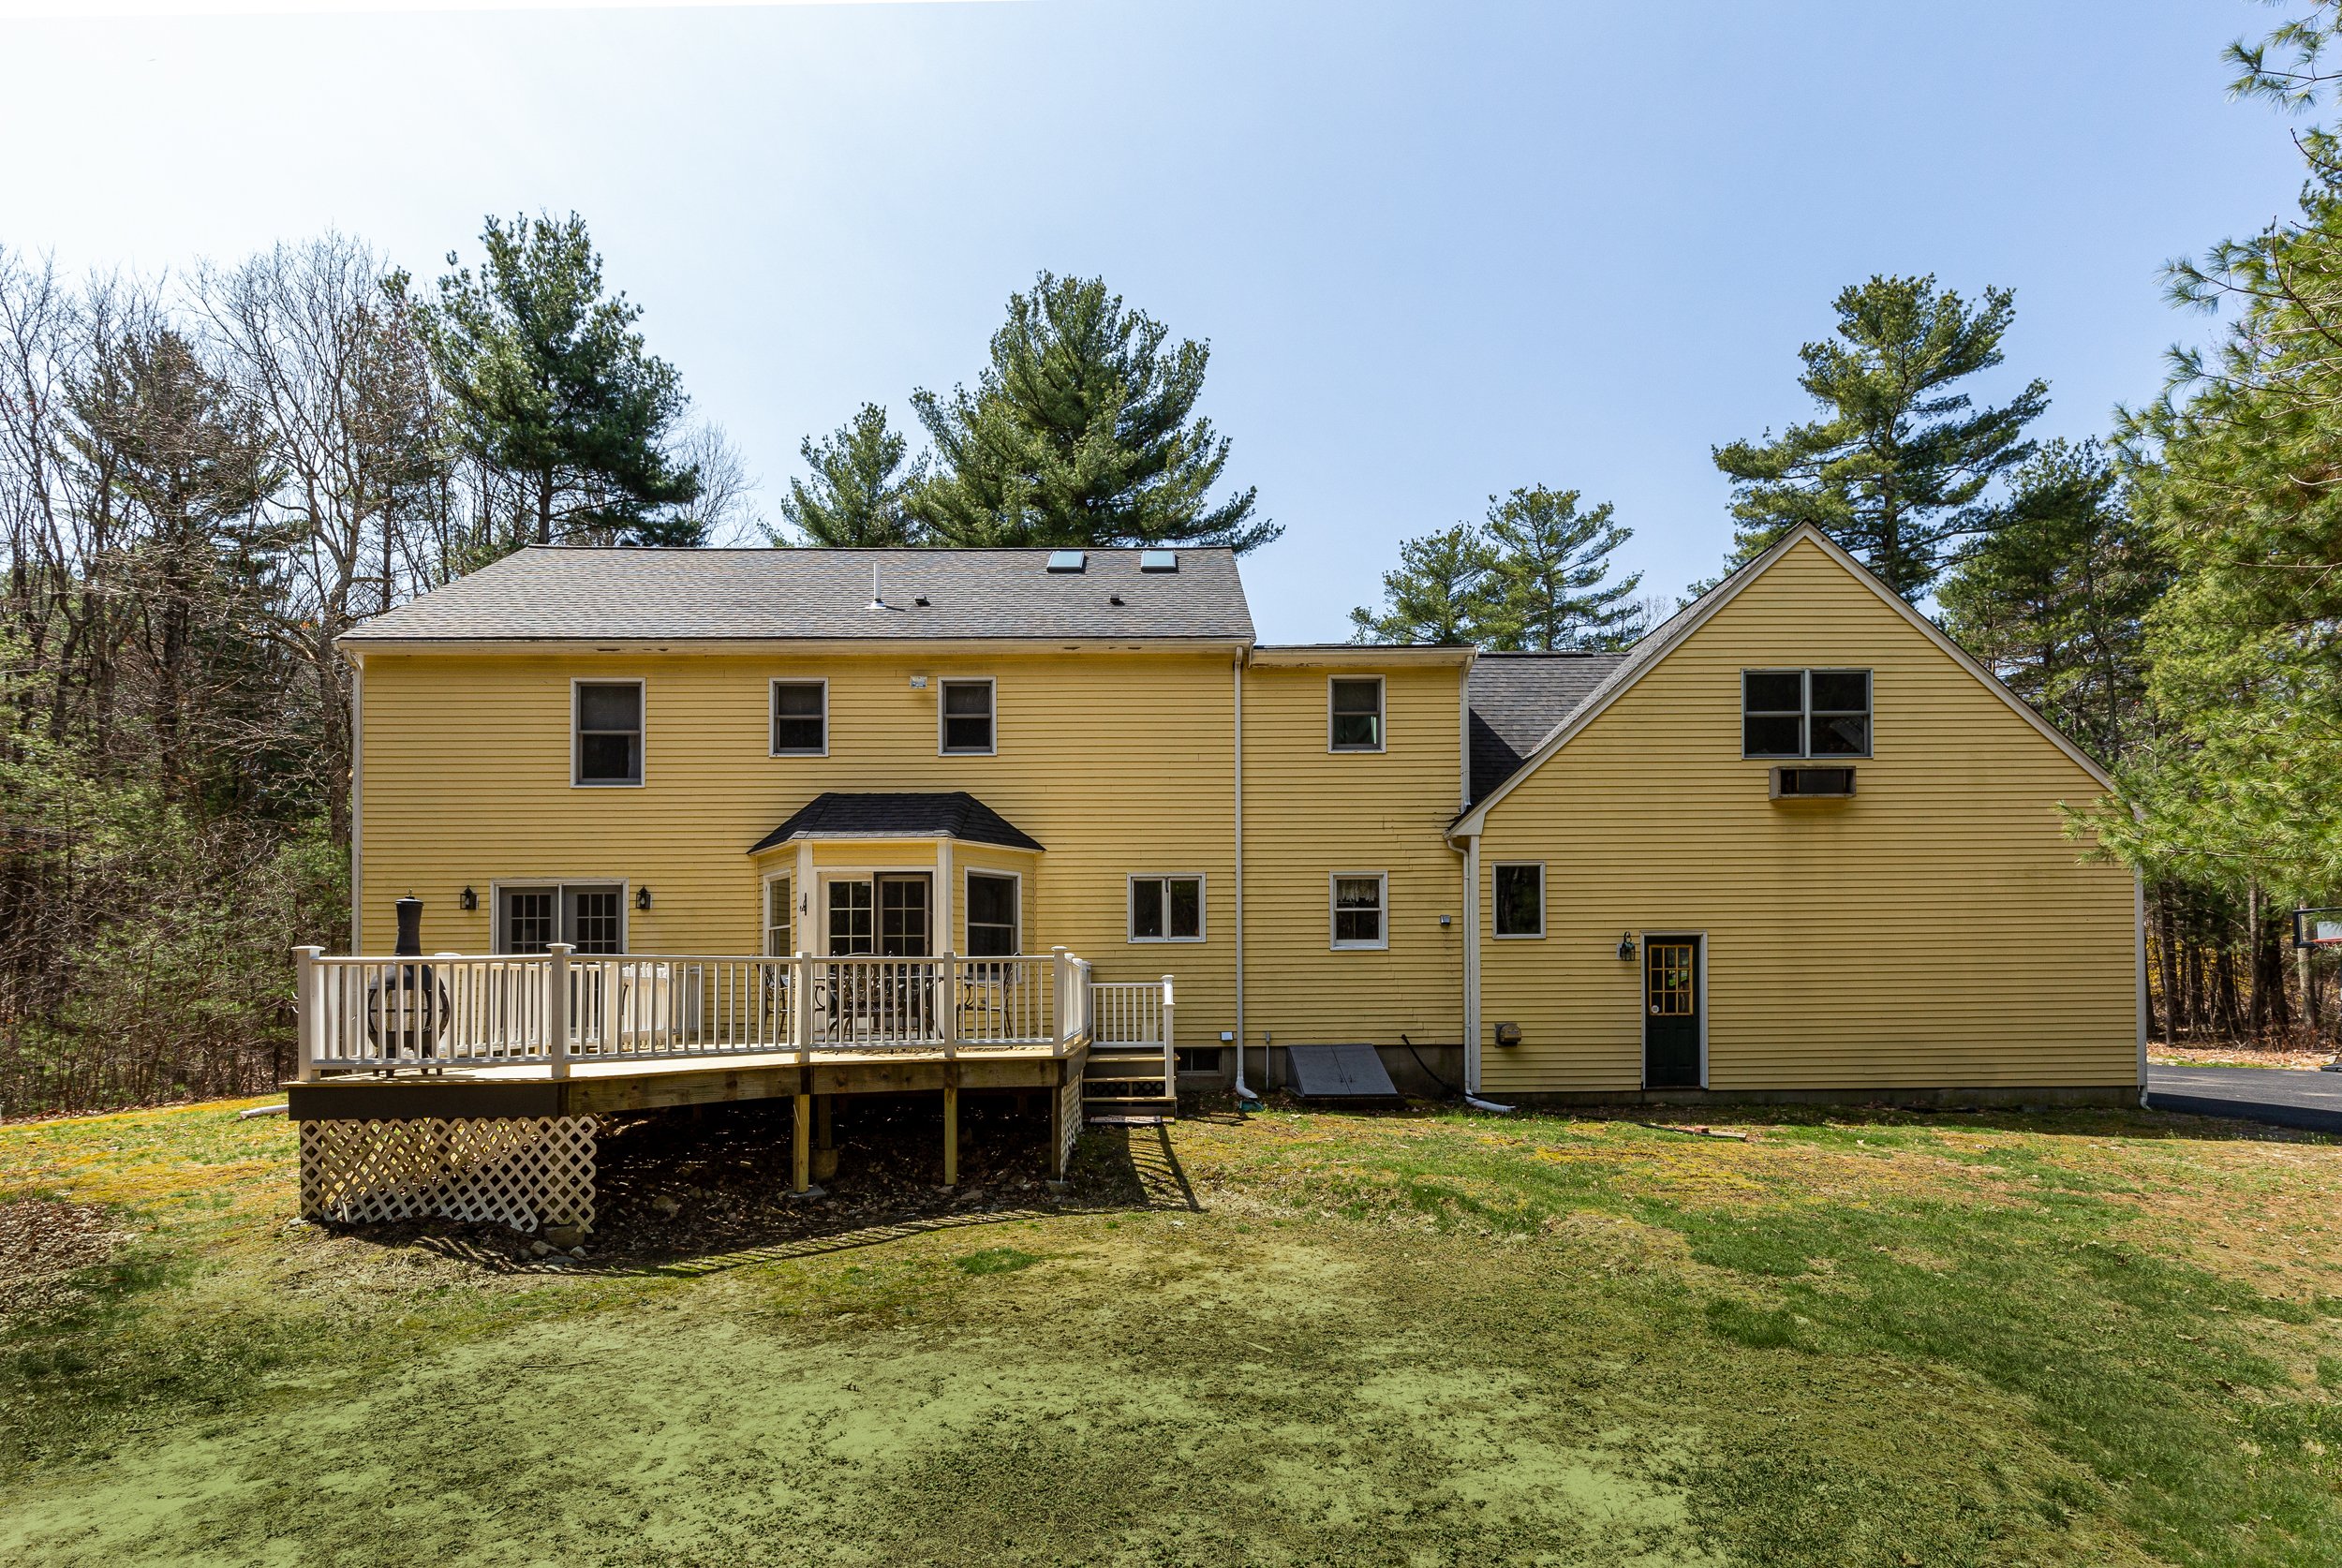
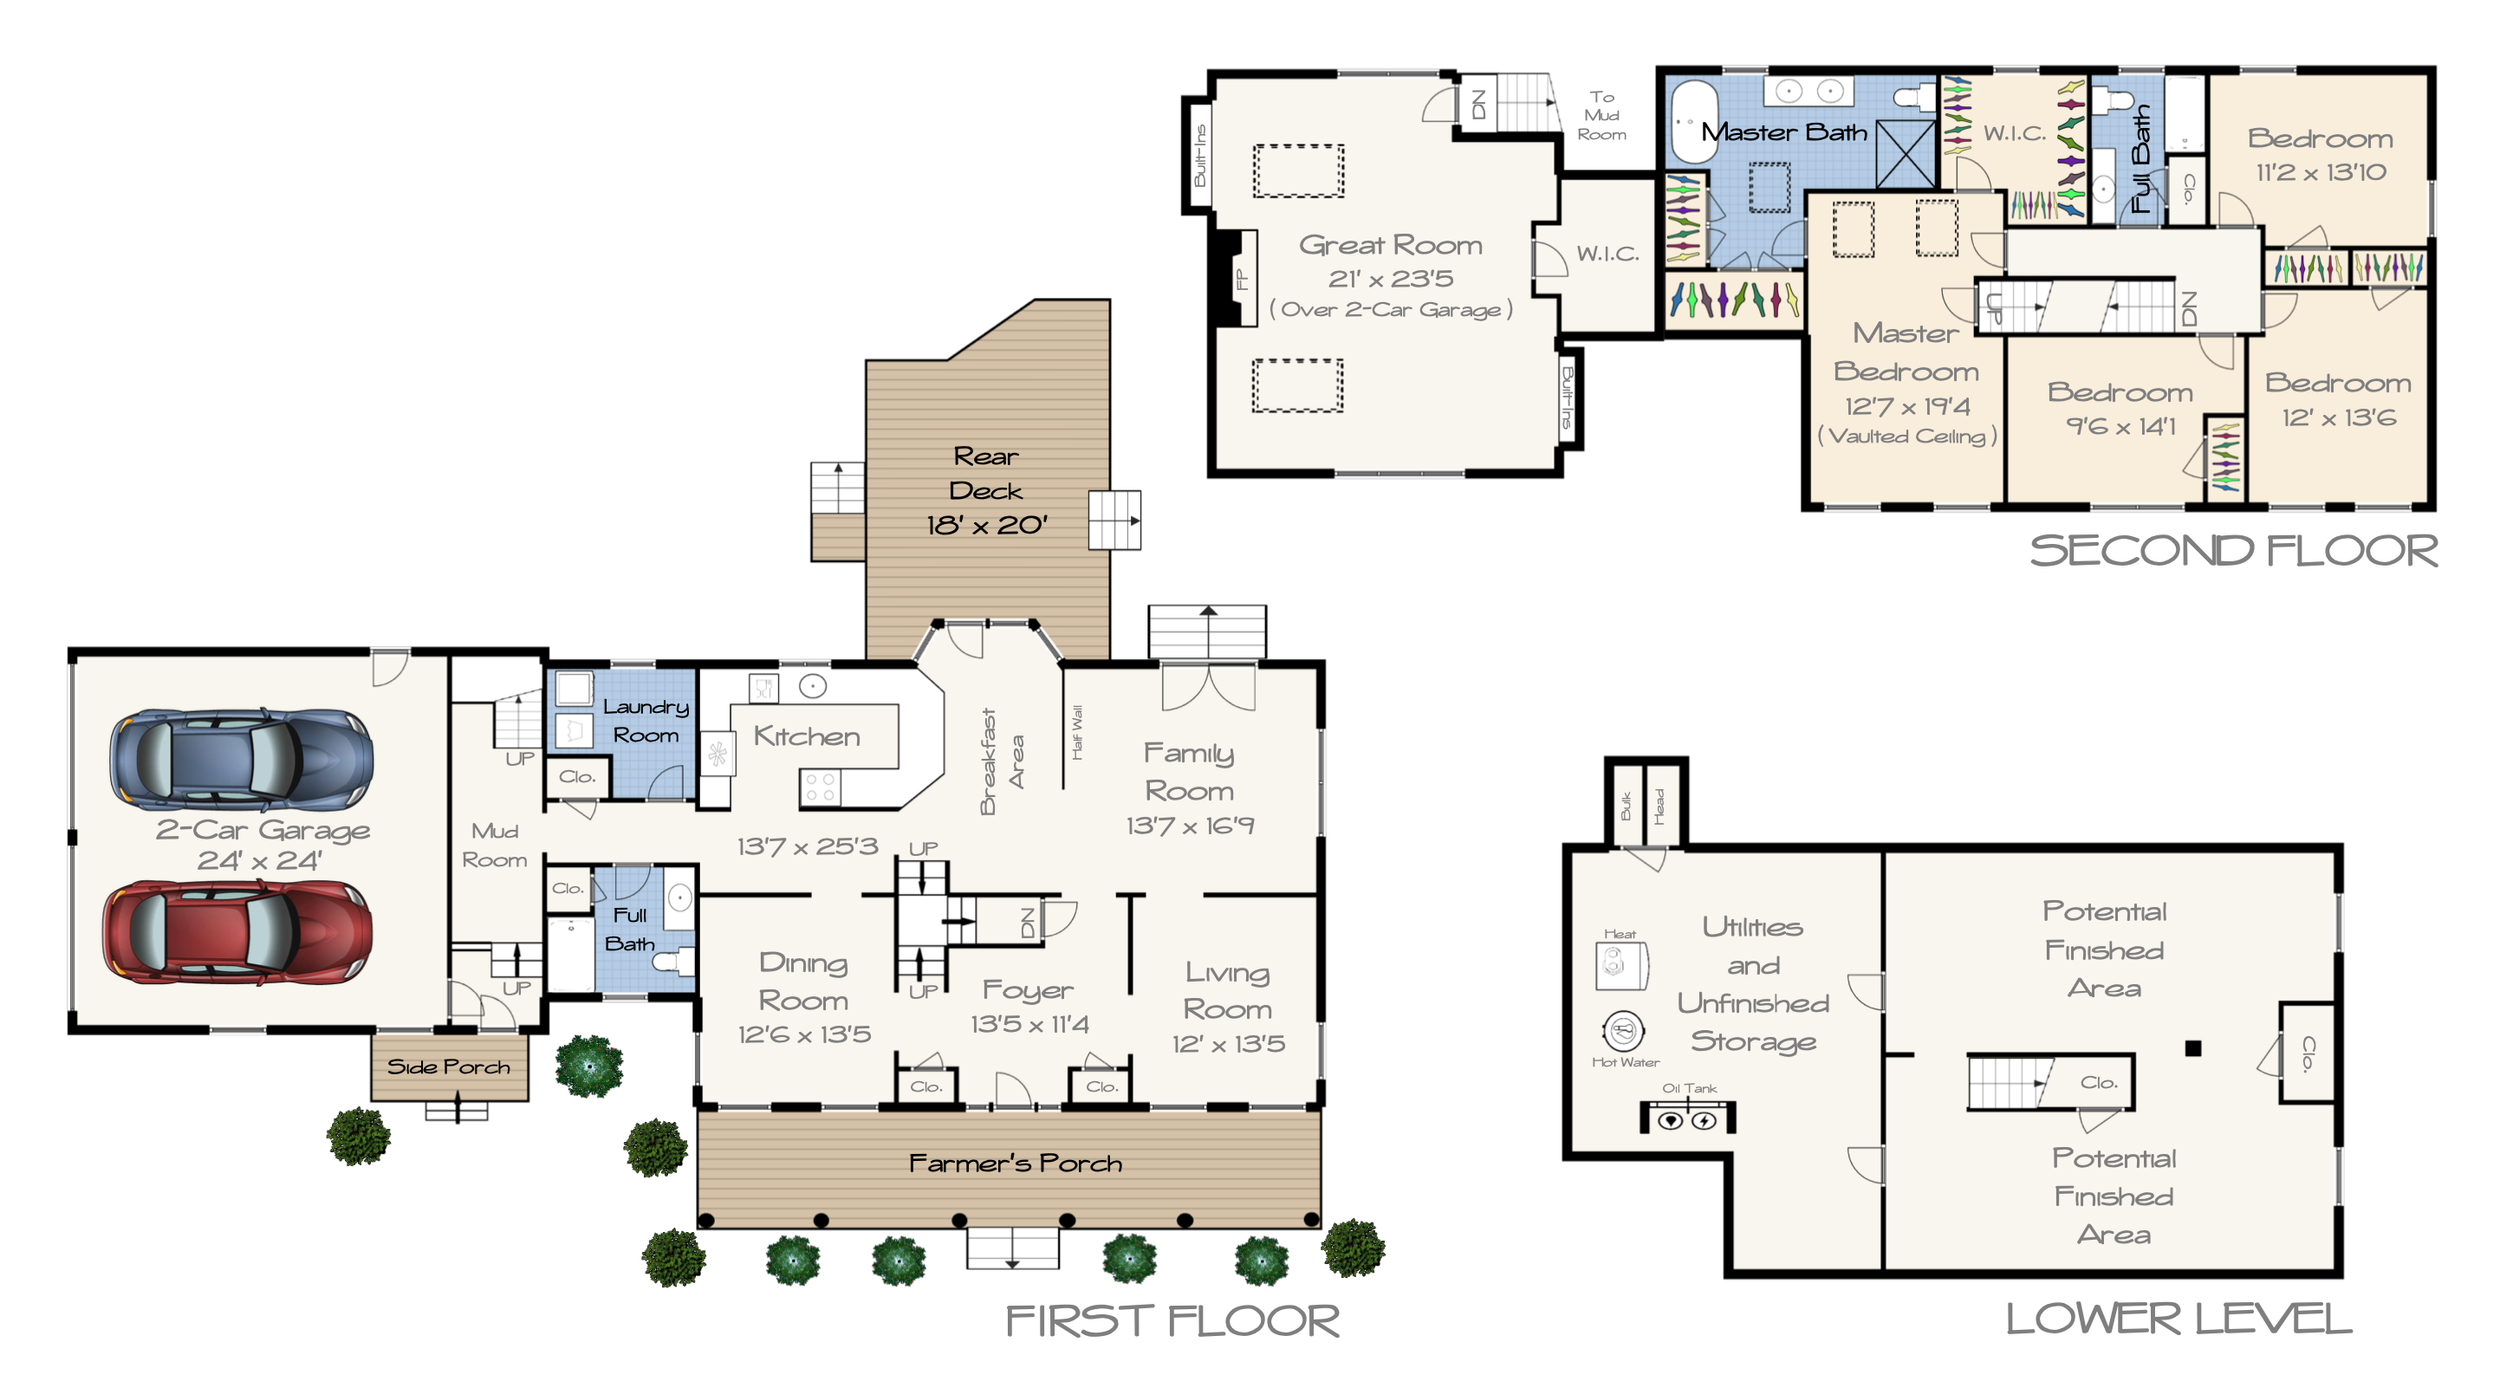
Bordering 113 acres of state forest at the end of a quiet cul-de-sac you’ll find 5 Laurel Tree Drive. Nestled on 3.5 acres, its post and beam construction, large planked flooring, beamed ceilings, and a covered front farmers porch are just a few of this homes standout characteristics… Your first floor laundry and a full bathroom are located right off of the mudroom, making that end of day cleanup easier than ever. An open concept kitchen/breakfast/family room that is sure to be the heart of family gatherings. And, a primary ensuite that’s as lavish as it is spacious! 5 Laurel Tree Dr meets the needs of today’s multi-generational living and work at home lifestyles, with a substantial great room over the two car garage and sizable full basement. These spaces are perfect for a game room, home office, or even a living space for in-laws or your college grad. The property is conveniently located near routes 1, 140, I-95, Patriot Place, and slew of fabulous restaurants. Make time to come see for yourself. We look forward to showing you around!
Request More Info or Book a Tour
IMPROVEMENTS
Rebuilt deck in 2022
New roof in 2017
Master bath renovated in 2017
New skylights in 2017
Heating update in 2015 (gas available at street)
Major addition of garage, mudroom, and family room in 2000
Whole house generator included
HOME & PROPERTY INFO
Lot Size: 3.51 acres
Year Built: 1992
Style: Colonial, farm house
Total Rooms: 10
Basement: Full, finished
Parking: 2 garage, 6 driveway
Heating: Oil, hot water baseboard
Cooling: Window A/C
Cooking: Electric
Water: Town
Sewer: Private (Title 5: Pass)
Estimated 2022 Taxes: $10,058
Request More Info or Book a Tour
Call Tracy at (508) 463-6481 or email us via the form below.
Are Home Prices Going Up or Down?
Media coverage about what’s happening with home prices can be confusing. A large part of that is due to the type of data being used and what they’re choosing to draw attention to. For home prices, there are two different methods used to compare home prices over different time periods: year-over-year (Y-O-Y) and month-over-month (M-O-M). Here's an explanation of each.
Year-over-Year (Y-O-Y):
This comparison measures the change in home prices from the same month or quarter in the previous year.For example, if you're comparing Y-O-Y home prices for April 2023, you would compare them to the home prices for April 2022.
Y-O-Y comparisons focus on changes over a one-year period, providing a more comprehensive view of long-term trends. They are usually useful for evaluating annual growth rates and determining if the market is generally appreciating or depreciating.
Month-over-Month (M-O-M):
This comparison measures the change in home prices from one month to the next. For instance, if you're comparing M-O-M home prices for April 2023, you would compare them to the home prices for March 2023.
Meanwhile, M-O-M comparisons analyze changes within a single month, giving a more immediate snapshot of short-term movements and price fluctuations. They are often used to track immediate shifts in demand and supply, seasonal trends, or the impact of specific events on the housing market.
The key difference between Y-O-Y and M-O-M comparisons lies in the time frame being assessed. Both approaches have their own merits and serve different purposes depending on the specific analysis required.
Why Is This Distinction So Important Right Now?
We’re about to enter a few months when home prices could possibly be lower than they were the same month last year. April, May, and June of 2022 were three of the best months for home prices in the history of the American housing market. Those same months this year might not measure up. That means, the Y-O-Y comparison will probably show values are depreciating. The numbers for April seem to suggest that’s what we’ll see in the months ahead (see graph below):
That’ll generate troubling headlines that say home values are falling, and that’s accurate on a Y-O-Y basis. But, those headlines will lead many consumers to believe that home values are currently cascading downward.
However, on a closer look at M-O-M home prices, we can see prices have actually been appreciating for the last several months. Those M-O-M numbers more accurately reflect what’s truly happening with home values: after several months of depreciation, it appears we’ve hit bottom and are bouncing back.
Here’s an example of M-O-M home price movements for the last 16 months from the CoreLogic Home Price Insights report (see graph below):
Why Does This Matter to You?
So, if you’re hearing negative headlines about home prices, remember they may not be painting the full picture. For the next few months, we’ll be comparing prices to last year’s record peak, and that may make the Y-O-Y comparison feel more negative. But, if we look at the more immediate, M-O-M trends, we can see home prices may actually be on the way back up.
Bottom Line
If you have questions about what’s happening locally or how this impacts your home’s price, please don’t hesitate to reach out!
Real Estate Market Report: March 2022
March is officially behind us so it’s time for our monthly check-in on the Massachusetts real estate market. Today we’ll discuss the implications of the total residential inventory across the state as well as the median home price.
TOTAL RESIDENTIAL INVENTORY
STATEWIDE INVENTORY
Single-family, condo & multi-family listings
Mar 2019: 13,482 listings
Feb 2022: 3,927 listings
Mar 2022: 4,470 listings
Compared to last year, inventory is still very low. In fact, inventory is 66.8% lower than it was in March in 2019 (pre-COVID times). That’s a whopping 9,012 homes.
On the bright side, month-over-month inventory is starting to come back. There are 543 more homes on the market this month bringing the total to 4,470. That’s a 13.8% increase from February. Still, we have a long ways to go to satisfy current demand.
MEDIAN HOME PRICE
STATEWIDE Median Home Price
Single-family, condo & multi-family listings
Mar 2019: $519,000
Feb 2022: $689,900
Mar 2022: $699,900
As you’re probably aware, home values are quite high right now… The median home price across the state has increased by $180,900 since March of 2019.
This 34.8% increase was due to a variety of factors, most notably the sharp decrease in both interest rates and home inventory.
Historically, home values nationwide appreciate about 3% a year. In Massachusetts, from March 2010 to March 2019, home values rose by about 58% or roughly 6% per year. Compare that to the 11.6% annual appreciation that we are currently seeing and it is obvious that home values are quite a bit ahead of where they should be.


